
Fig. 2
- ID
- ZDB-IMAGE-150317-2
- Publication
- Ariza-Cosano et al., 2015 - sox21a directs lateral line patterning by modulating FGF signaling
- All Figures
- Figures for Ariza-Cosano et al., 2015
|
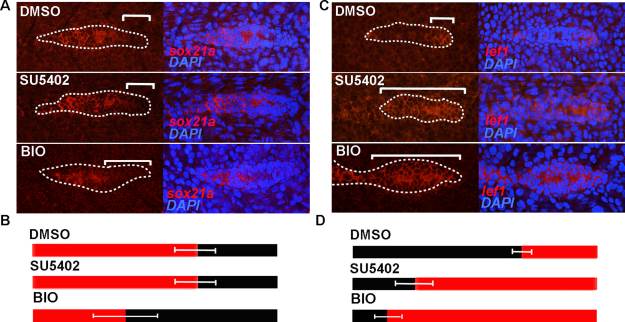
Fig. 2 Effect of the knockdown of the Fgf pathway by SU5402 and the ectopic activation of the Wnt pathway by BIO in the expression of sox21a and lef1. A and C) Expression pattern of sox21a (A) and lef1 (C) in controls (DMSO) and SU5402 incubated embryos (SU5402) and BIO incubated embryos (BIO). Left panels show the expression pattern of the respective gene and right panels the overlay with the nuclear marker DAPI (blue). White brackets represent distance from the leading tip of the pLL primordium to the limit of expression of the respective transcript. B and D) Diagram representing in red the limits of expression of sox21a (B) and lef1 (D) in control (DMSO), SU5402 (SU5402) or BIO incubation conditions (BIO). The number of pLL primordia analyzed were the following: sox21a DMSO (n = 8), sox21a SU5402 (n = 11), sox21a BIO (n = 19), lef1 DMSO (n = 10) and lef1 SU5402(n = 9), lef1 BIO (n = 10). Standard deviation of the measured distances is represented.