
Fig. 1
- ID
- ZDB-IMAGE-150317-1
- Publication
- Ariza-Cosano et al., 2015 - sox21a directs lateral line patterning by modulating FGF signaling
- All Figures
- Figures for Ariza-Cosano et al., 2015
|
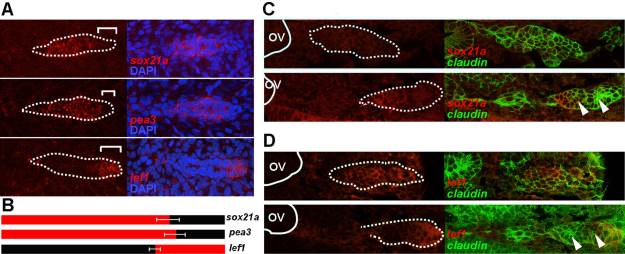
Fig. 1 Expression pattern of sox21a, pea3, and lef1 in the pLL primordium. A) Left panels show confocal images of the pLL primordium at 36hpf labeled with the indicated RNA probe in the respective order: sox21a, pea3, and lef1 (red; top to bottom). White dotted lines mark the borders of the pLL primordium and white brackets mark the distance from the tip of the pLL primordium leading zone to the limit of expression of the respective transcript. Right panels show the overlay with the nuclear marker DAPI (blue). B) Diagram representing the limits of expression for each gene (red) as described in A) (white brackets). The number of pLL primordia analyzed were the following: sox21a (n = 6), pea3 (n = 5), and lef1 (n = 6). Standard deviation of the measured distances is represented. C and D) Expression of sox21a (C) and lef1 (D) early in the development of the pLL, previous to the formation of the first proneuromasts (above panels), and at a latter stage when the first proneuromasts is already detected (below panels). In situ hybridization signal is represented in red and GFP from the cldnb:gfp transgenic line in green. The otic vesicle is outlined by a white line (OV) and arrowheads mark proneuromasts.