
Fig. 5
- ID
- ZDB-IMAGE-150313-35
- Publication
- Presslauer et al., 2014 - Induced Autoimmunity against Gonadal Proteins Affects Gonadal Development in Juvenile Zebrafish
- All Figures
- Figures for Presslauer et al., 2014
|
Fig. 5
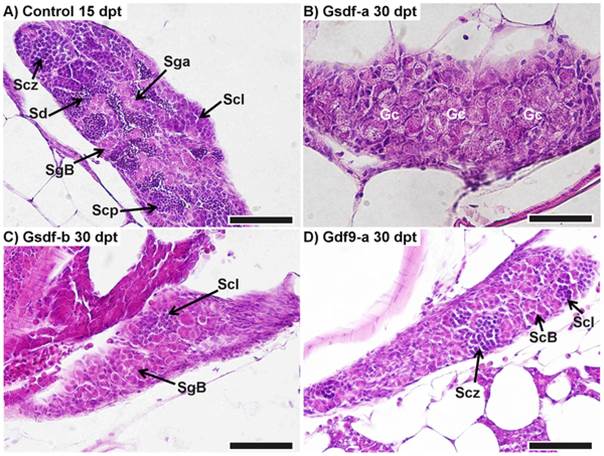
Retardation in testis development.
A) Representation of normally developing testis in a control male (78.0 mg, 21.5 mm) at 15 days post treatment (dpt). B) Retarded development in an anti-Gsdf-a treated male at 30 dpt (132.0 mg, 25.5 mm): initial phase of differentiation with only undifferentiated gonocytes visible. C) Testis of an anti-Gsdf-b treated fish at 30 dpt (108.5 mg, 24.0 mm): the testis consisted predominantly of spermatogonia with the start of the spermatocyte phase visible. D) Testis of an anti-Gdf9-a treated fish at 30 dpt (89.4 mg, 22.4 mm): spermatocytes reached the zygotene stage of meiotic prophase. SgA – spermatogonia type A, SgB – spermatogonia type B, Scl – spermatocytes, leptotene of meiotic prophase, Scz – spermatocytes, zygotene of meiotic prophase, Scp – spermatocytes at pachytene stage, Sd – spermatids, Gc – undifferentiated gonocytes. All scalebars represent 50 µm.