
Fig. 4
- ID
- ZDB-IMAGE-150313-27
- Genes
- Publication
- Huc-Brandt et al., 2014 - Zebrafish Prion Protein PrP2 Controls Collective Migration Process during Lateral Line Sensory System Development
- All Figures
- Figures for Huc-Brandt et al., 2014
|
Fig. 4
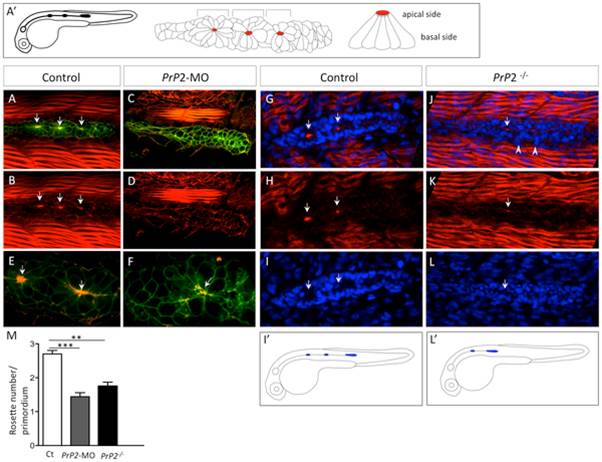
Primodium disorganisation and absence of rosette formation.
A′. Schematic representation of a normal claudinB-GFP embryo at 30 hpf and detailed organization of the primordium with rosette structure. Red spot indicates a normal concentration point of actin. A, B. Phalloidin staining (Phalloidin-TRITC) in control embryo claudinB-GFP, at 30 hpf, is observed in muscle cells and within the primodium at the center of the rosette (arrows), on the apical side. C, D. Phalloidin-TRITC staining in PrP2-MO, no rosette structure is observed and no actin concentration is found. E, F. Higher magnification shows the co-localization of central actin concentration with claudinB-GFP at the rosette center in control. In morphants, cell disorganization is observed and no actin concentration is observed associated with the absence of a rosette. G–I. Phalloidin staining and DAPI nuclei labeling highlight the primordium and rosette center (arrows) in control embryos. J–L. In PrP2/ mutants, actin apical localization in rosette was severely reduced or barely detectable (arrow) and primordium organization at the periphery was impaired: loose cells were visible on the border (arrowheads). I2, L2. In PrP2/ mutant, the primordium position was often delayed and the first neuromast deposited close to the ear. M. Quantification of rosette number was established in control (n = 20), PrP2-MO (n = 84) and PrP2/ mutant (n = 28) using actin staining at the center, **: p<0.01, ***: p<0.001, Student t test. See also associated Movies S1–S5.