
|
Fig. S6
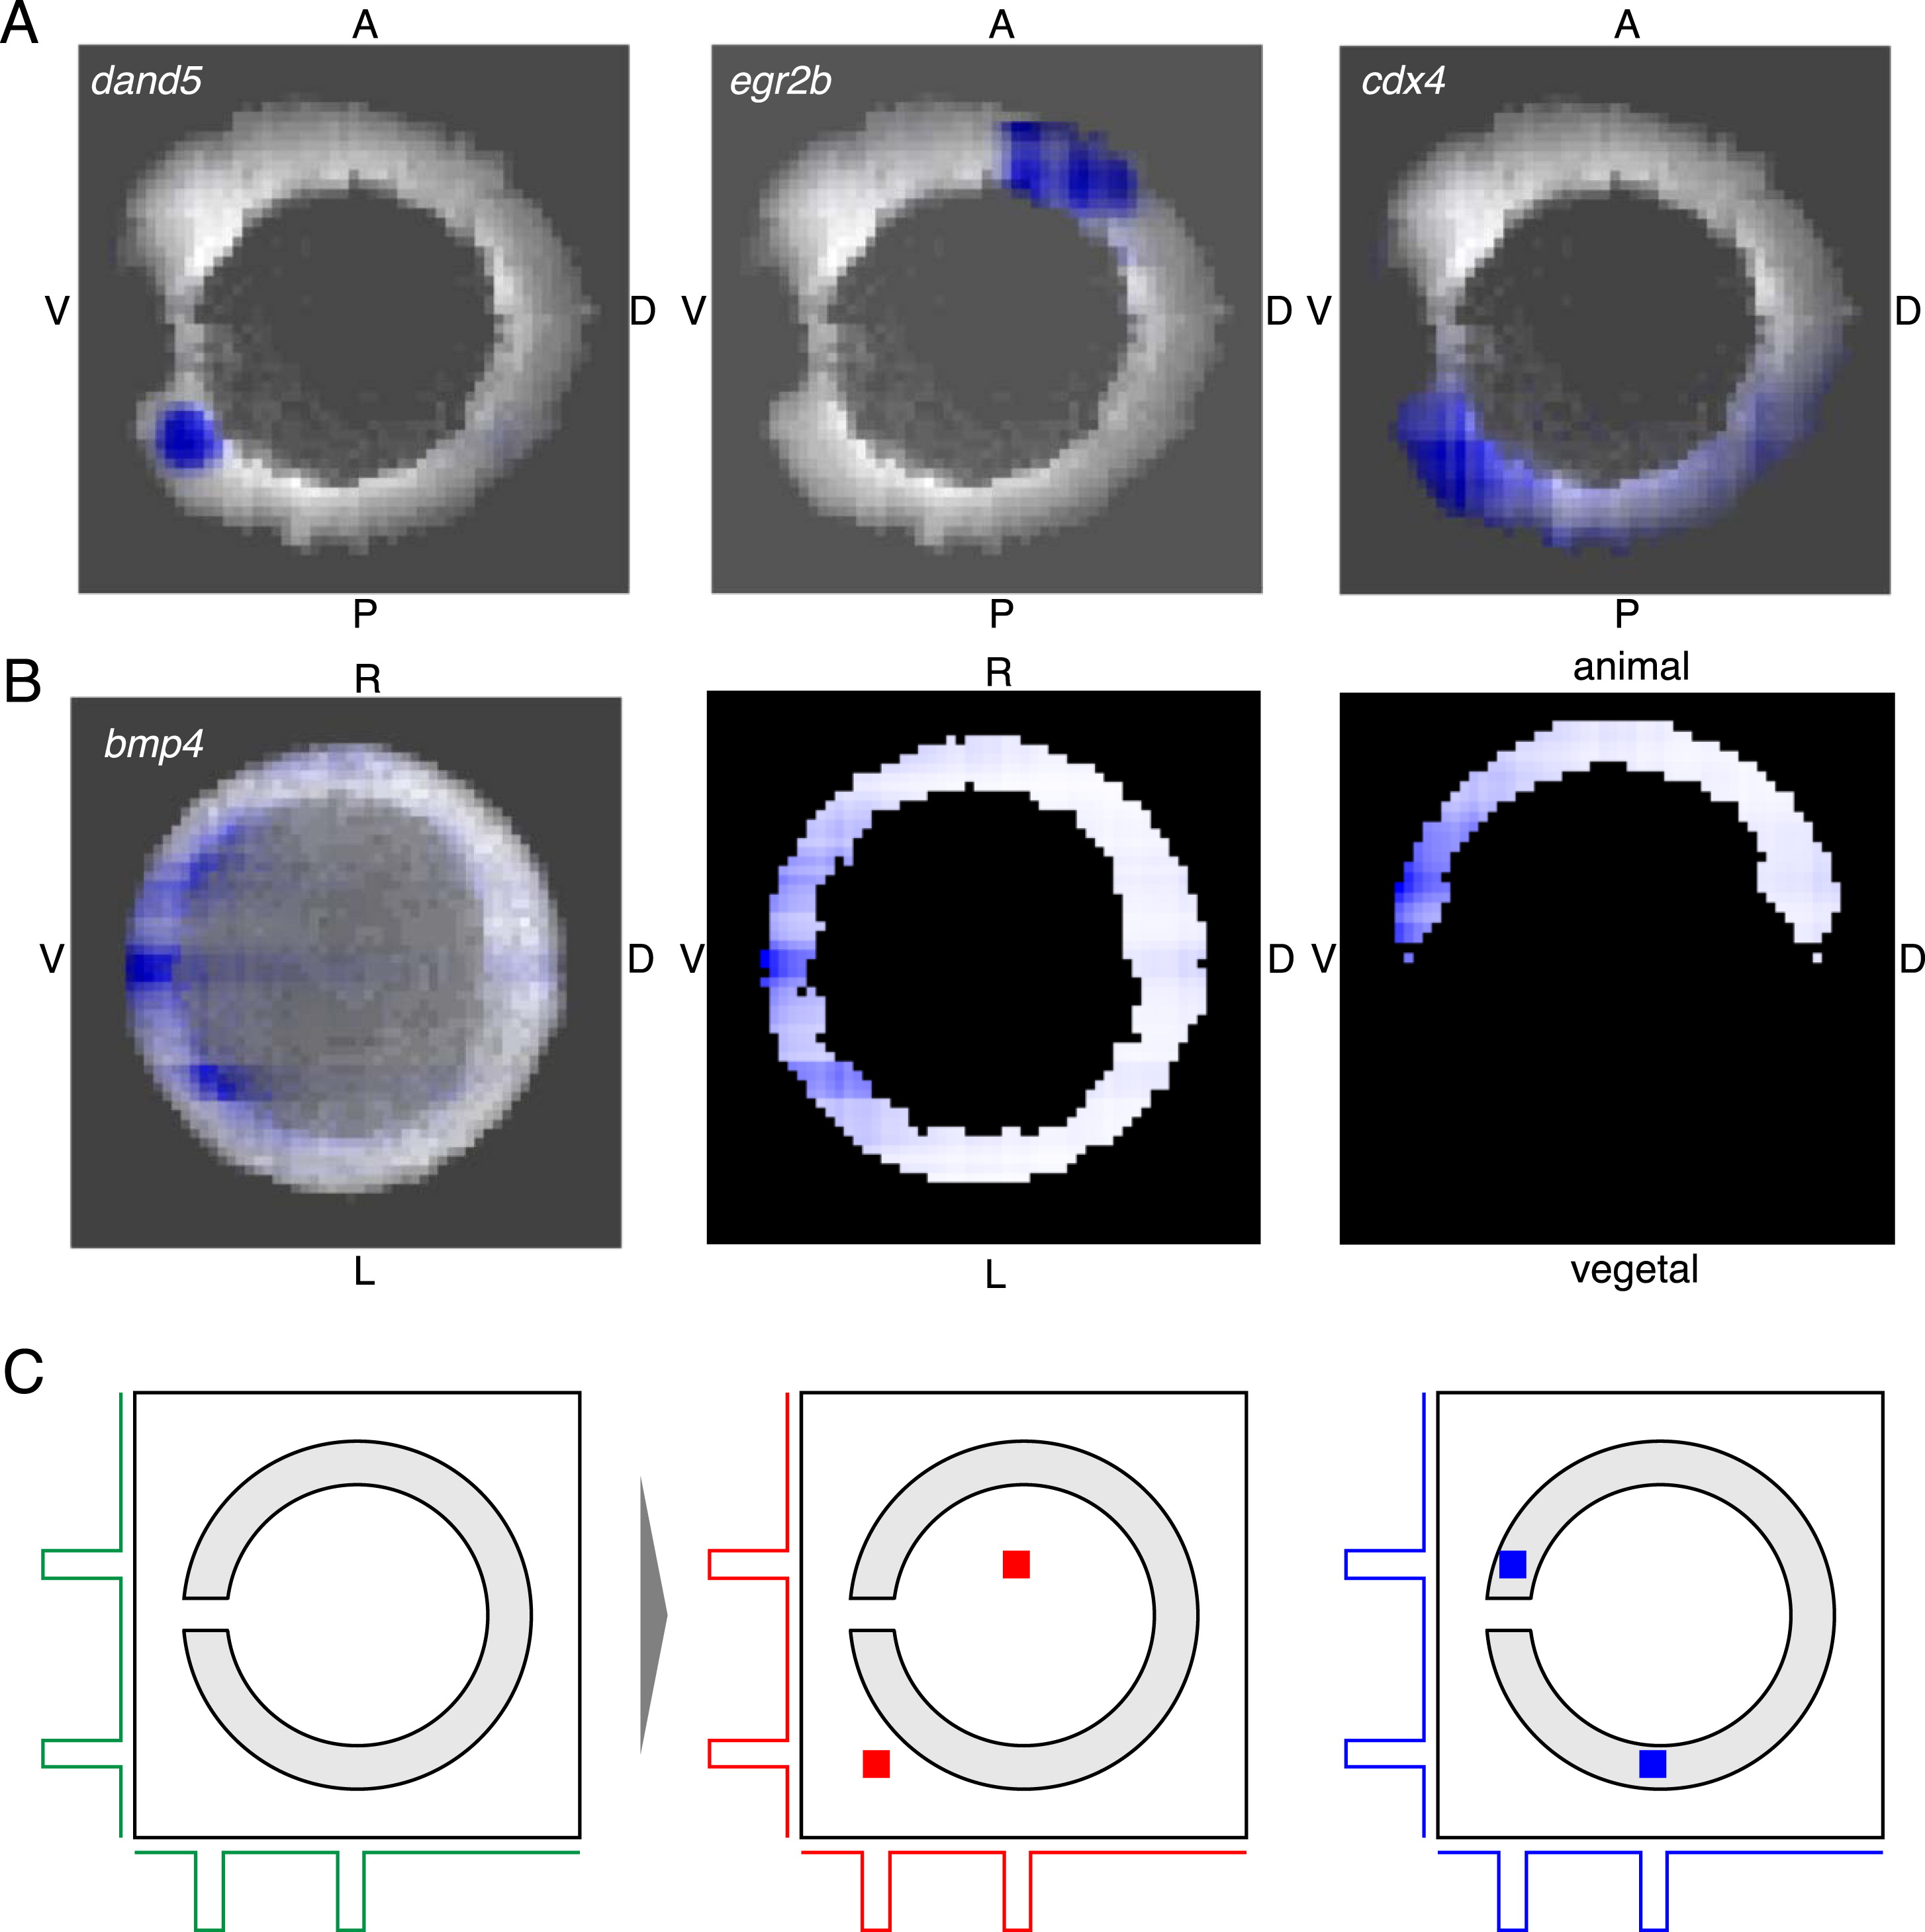
Approach for 3D Image Reconstruction Based on Tomo-Seq Data along the Three Main Body Axes, Related to Figure 6
(A) Projection images along LR axis for dand5, egr2b and cdx4 expression patterns at 10 somites stage.
(B) Left: Projection along animal-vegetal axis for bmp4 at shield stage. Middle: Expression in a plane perpendicular to animal-vegetal axis at the level of the margin. Right: Expression in a plane perpendicular to LR axis through the middle of the embryo.
(C) The 1D projections shown in green in the left panel can potentially give rise to artifacts: The red pattern (middle) and the blue pattern (right) lead to the same 1D projections and can hence not be easily distinguished. However, we can rule out the red pattern by taking into account the shape of the embryo measured in Figures S5C and S5D – the red squares lie outside the embryo and are hence not valid solutions.
Reprinted from Cell, 159, Junker, J.P., Noël, E.S., Guryev, V., Peterson, K.A., Shah, G., Huisken, J., McMahon, A.P., Berezikov, E., Bakkers, J., van Oudenaarden, A., Genome-wide RNA Tomography in the Zebrafish Embryo, 662-75, Copyright (2014) with permission from Elsevier. Full text @ Cell