
Fig. 5
- ID
- ZDB-IMAGE-150309-27
- Publication
- Freisinger et al., 2014 - Live Imaging and Gene Expression Analysis in Zebrafish Identifies a Link between Neutrophils and Epithelial to Mesenchymal Transition
- All Figures
- Figures for Freisinger et al., 2014
|
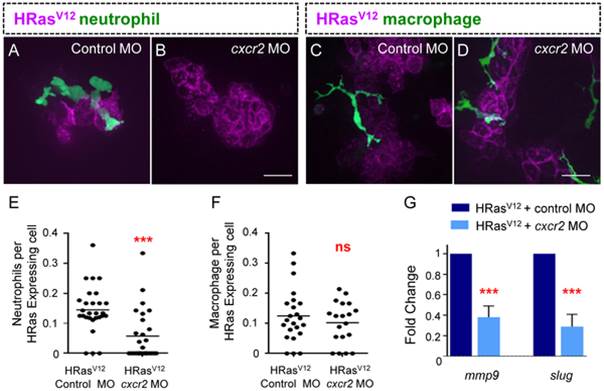
Fig. 5 Cscr2 is required for EMT related gene expression in HRasV12 expressing epithelial cells.
(A–B) Fluorescent Z stack projections of live 3.5 dpf transgenic mpx:GFP (green neutrophils) control MO injected (A) and cxcr2 morphant (B). (C–D) Fluorescent Z stack projections of live 3.5 dpf transgenic mpeg:Dendra (green macrophages), control MO injected (C) and cxcr2 morphant (D). (E) Quantification of A–B (as a ratio of neutrophils per transformed cell) reveals a significant decrease in neutrophil recruitment to HRasV12 expressing cells in cxcr2 MO injected larvae compared to control. (F) Quantification of C–D (as a ratio of macrophages per transformed cell) shows that macrophage numbers at HRasV12 expressing cells in cxcr2 MO injected larvae is similar to macrophage numbers at HRasV12 expressing cells in control larvae. (G) Quantitative RT-PCR (one representative graph shown n = 4) indicates a statistically significant decrease in mmp9 and slug transcripts in transformed cells from cxcr2 MO injected larvae when compared to control MO injected larvae. *** = P<.001, ns = not significant. Scale bar = 20 microns.