
Fig. 6
- ID
- ZDB-IMAGE-150304-6
- Publication
- Campbell et al., 2013 - Local caspase activation interacts with Slit-Robo signaling to restrict axonal arborization
- All Figures
- Figures for Campbell et al., 2013
|
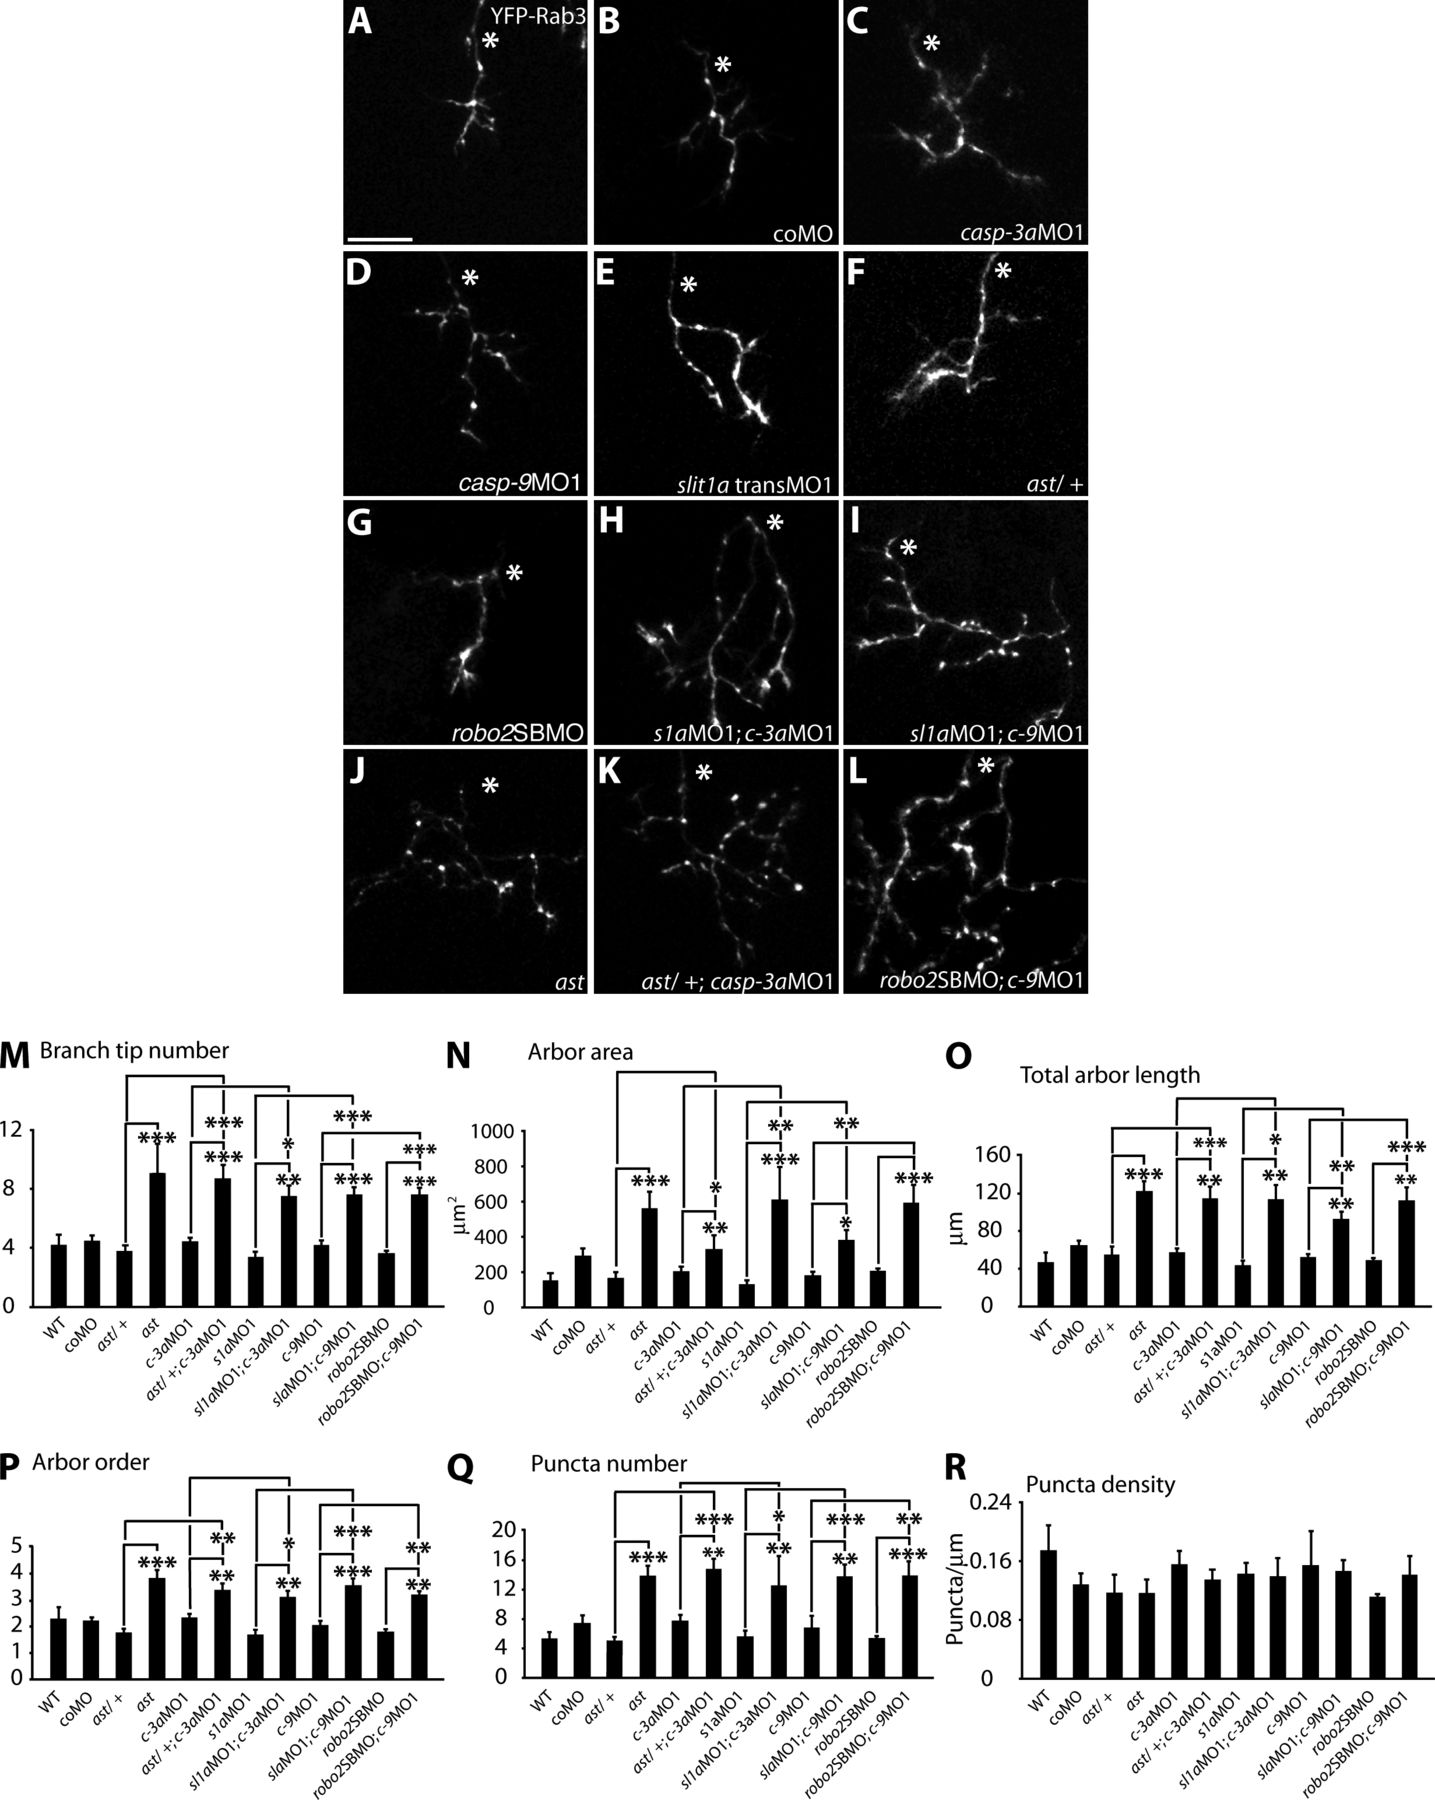
Fig. 6 Caspases-3 and -9 interact with Slit1a-Robo2 signaling to restrict arbor size. (A–L) Maximum intensity projections of 80-hpf RGC arbors in the optic tectum expressing YFP-Rab3. WT (A), coMO (B), casp-3aMO1 (C), casp-9MO1 (D), slit1a transMO1 (low dose; E), ast/+ (F), robo2SBMO1 (low dose; G), slit1a transMO1 (low dose); casp-3aMO1 (H), slit1a transMO1 (low dose; I), ast (J), ast/+; casp-3aMO1 (K), and robo2SBMO1 (low dose); casp-9MO1 (L) are shown. (M–R) Quantification of arbor parameters: branch tip number (M), arbor area (N), total arbor length (O), arbor order (P), presynaptic puncta number (Q), and puncta density (R). 7–15 arbors were analyzed per condition. Part of the ast data is obtained from Campbell et al. (2007). Dorsal views are shown, and anterior is up. White asterisks indicate the parent axon. Error bars represent SEMs. *, P < 0.05; **, P < 0.01; ***, P < 0.001. Bar, 10 μm.