
Fig. 6
- ID
- ZDB-IMAGE-150303-1
- Genes
- Publication
- de Oliveira-Carlos et al., 2013 - Notch receptor expression in neurogenic regions of the adult zebrafish brain
- All Figures
- Figures for de Oliveira-Carlos et al., 2013
|
Fig. 6
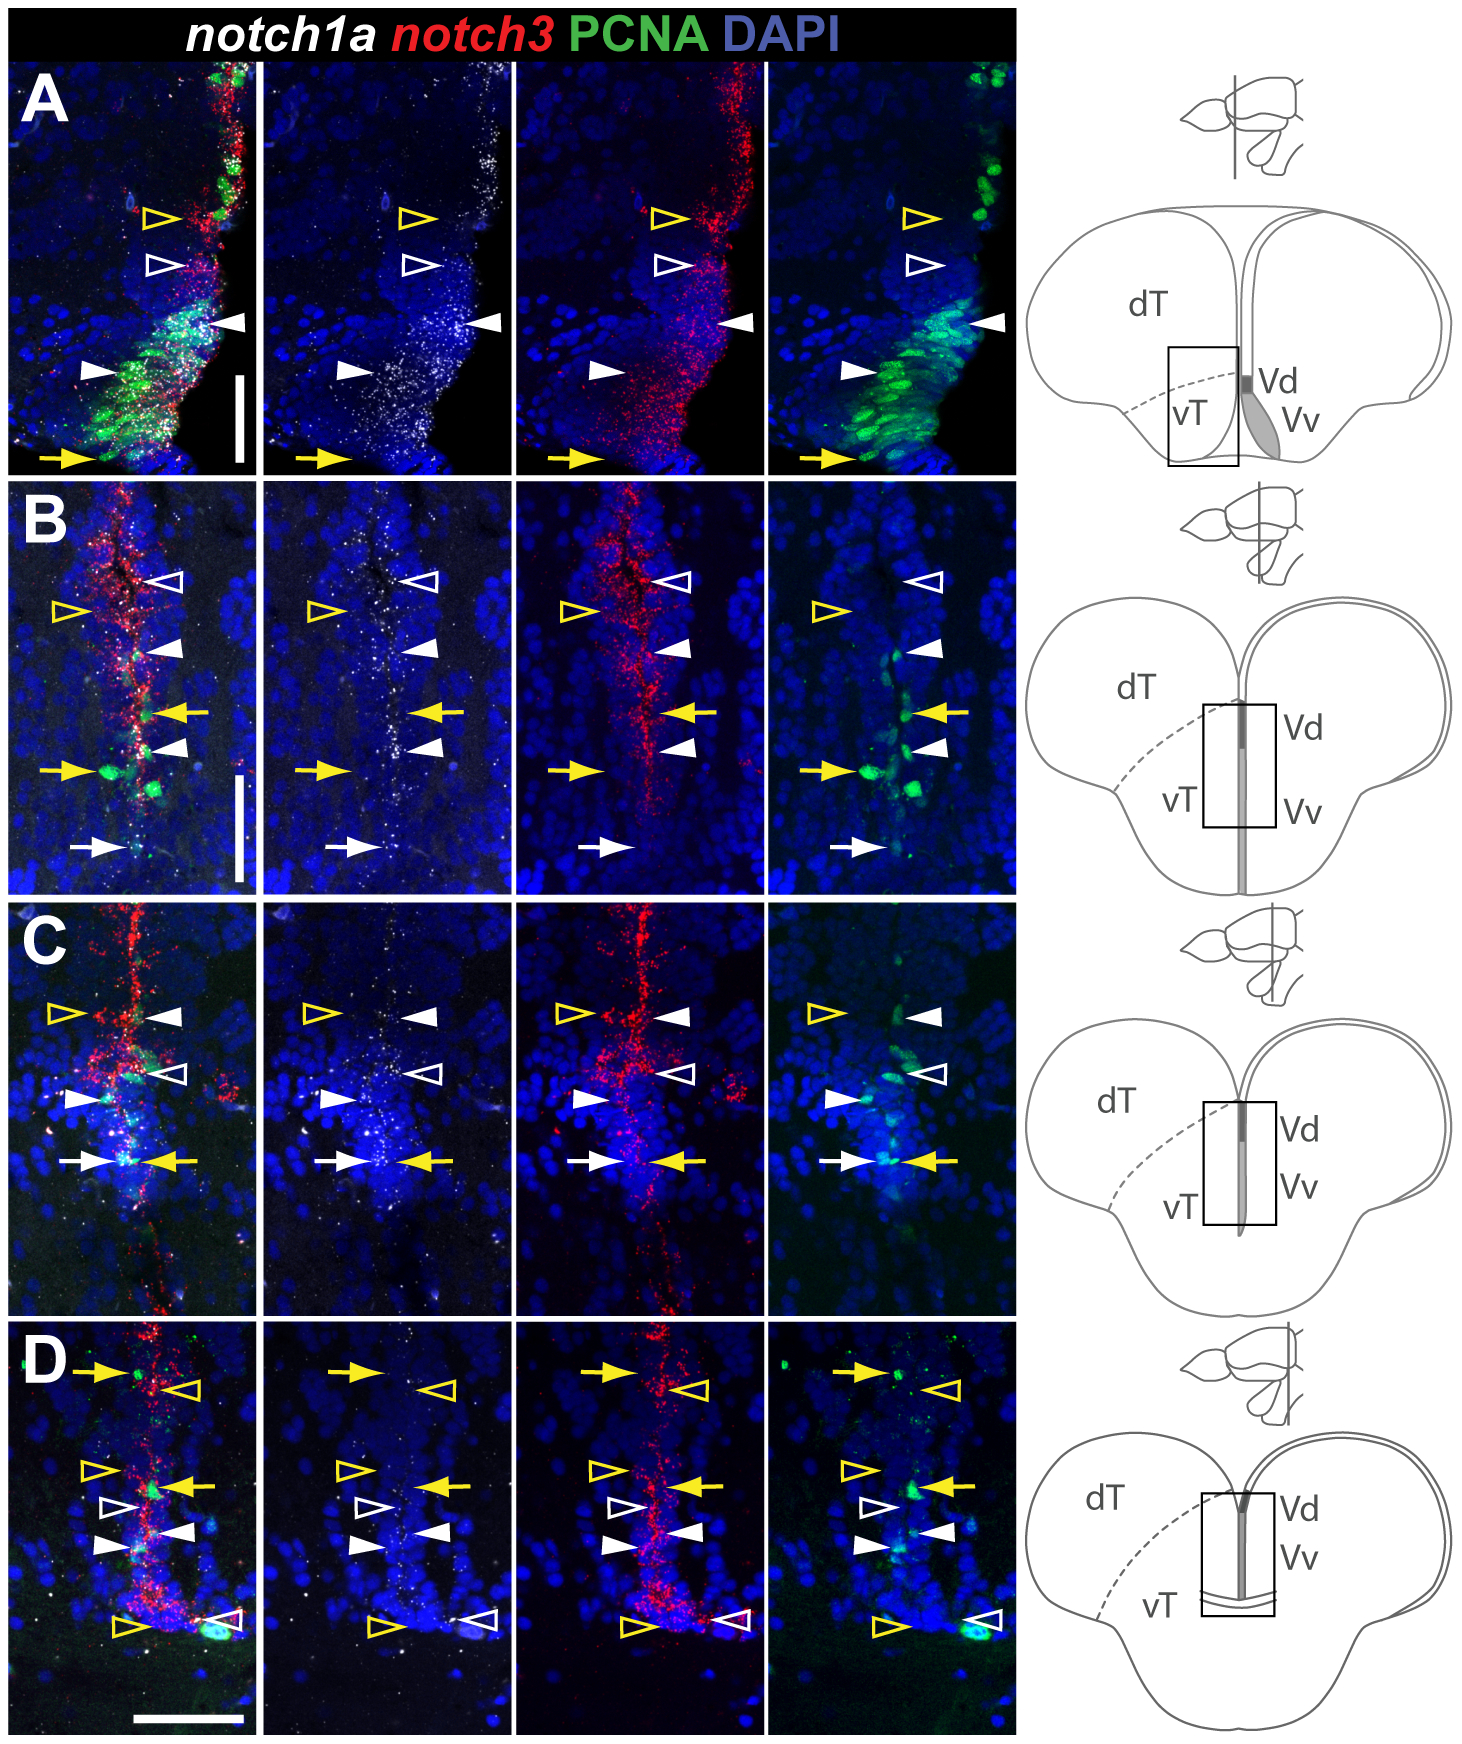
Overlapping and complementary notch1a/3 expression in the ventral telencephalic proliferation zone, along the rostro-caudal axis.
Confocal images showing localization of notch1a (white) and notch3 (red) by double FISH (white and red) and PCNA proliferating cells (green); DAPI (blue) is used as nuclear counterstaining. Areas represented in the micrographs are indicated in the cross-section schematics on the right as well as the different levels through the telencephalon. A-D, notch1a and notch3 expression domains along the rostro-caudal vT proliferation zone. Co-expression of these receptors both in PCNA (white filled arrowheads) and PCNA cells (unfilled white arrowheads); a few PCNA cells are Notch receptor (yellow arrows) while others are notch1a + /notch3 - (white filled arrows); unfilled yellow arrowheads indicate notch1a - /notch3+/PCNA - cells. Abbreviations: dT, dorsal telencephalic area; vT, ventral telencephalic area; Vd, dorsal nucleus of the ventral telencephalon; Vv, ventral nucleus of the ventral telencephalon. Scale bars = 50μm in A, B (applies to C) and D.