
Fig. 4
- ID
- ZDB-IMAGE-150120-7
- Genes
- Antibodies
- Publication
- Maeda et al., 2014 - Tip-link protein protocadherin 15 interacts with transmembrane channel-like proteins TMC1 and TMC2
- All Figures
- Figures for Maeda et al., 2014
|
Fig. 4
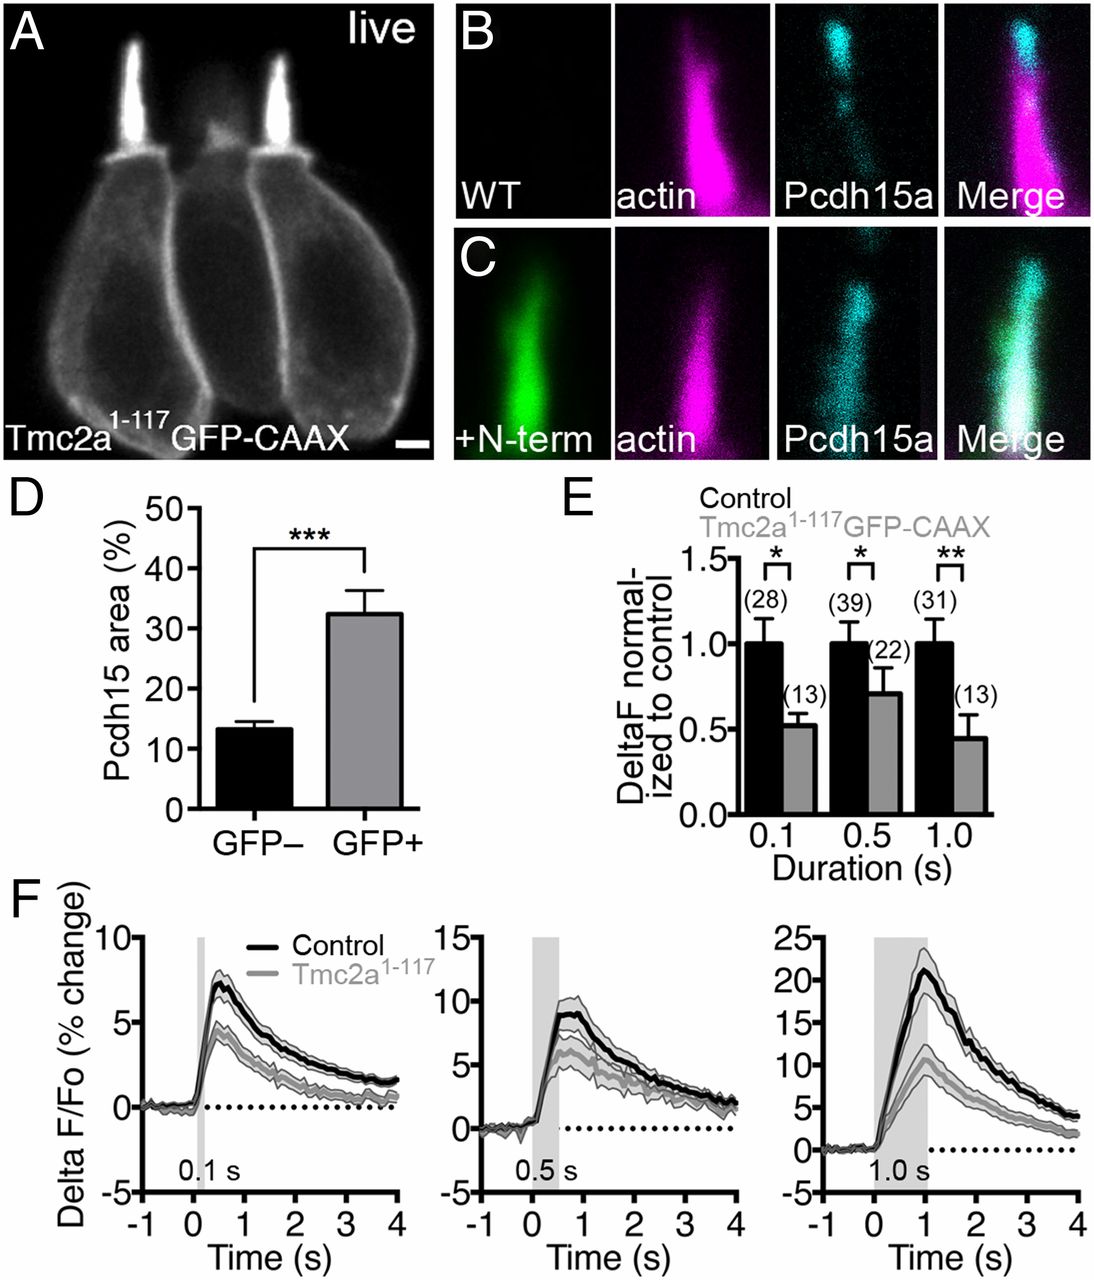
Expression of the N-terminal fragment of Tmc2a decreases mechanically evoked responses in zebrafish hair cells. (A) Live confocal image (0.35-μm z sections) of mosaic expression of Tmc2a1–117-GFP-CAAX in ampullary hair cells at 3 dpf. Two mature hair cells are shown in the focal plane. (B–D) Altered distribution of Pcdh15a in hair cells expressing Tmc2a1–117-GFP-CAAX (4 dpf). Control hair bundle (B) and Tmc2a1–117-GFP-CAAX–positive hair bundle (C) were labeled with anti-GFP antibody (green), phalloidin (magenta), and anti-Pcdh15a antibody (cyan). (D) Quantification of the increase in pixel area of Pcdh15a immunolabel within hair bundles (n = 19 hair bundles for each condition; Student t test). [Scale bar: 1.75 μm (A); 1 μm (B and C)]. (E) Response magnitude in Tmc2a1–117-GFP-CAAX–expressing cells normalized to control signals. The number of cells is indicated above the bars. A nonparametric Mann–Whitney U test (unpaired) was used to compare differences between Tmc2a1–117-GFP-CAAX and control hair cell calcium responses. (F) Averaged traces of mechanically evoked calcium responses are plotted as a percentage (ΔF F0/F0 × 100) and as a function of time in response to 0.1-, 0.5-, and 1.0-s steps. Duration of the step stimulus is indicated by the gray rectangles. The gray shading around traces in F and error bars in E indicates SEM.