
|
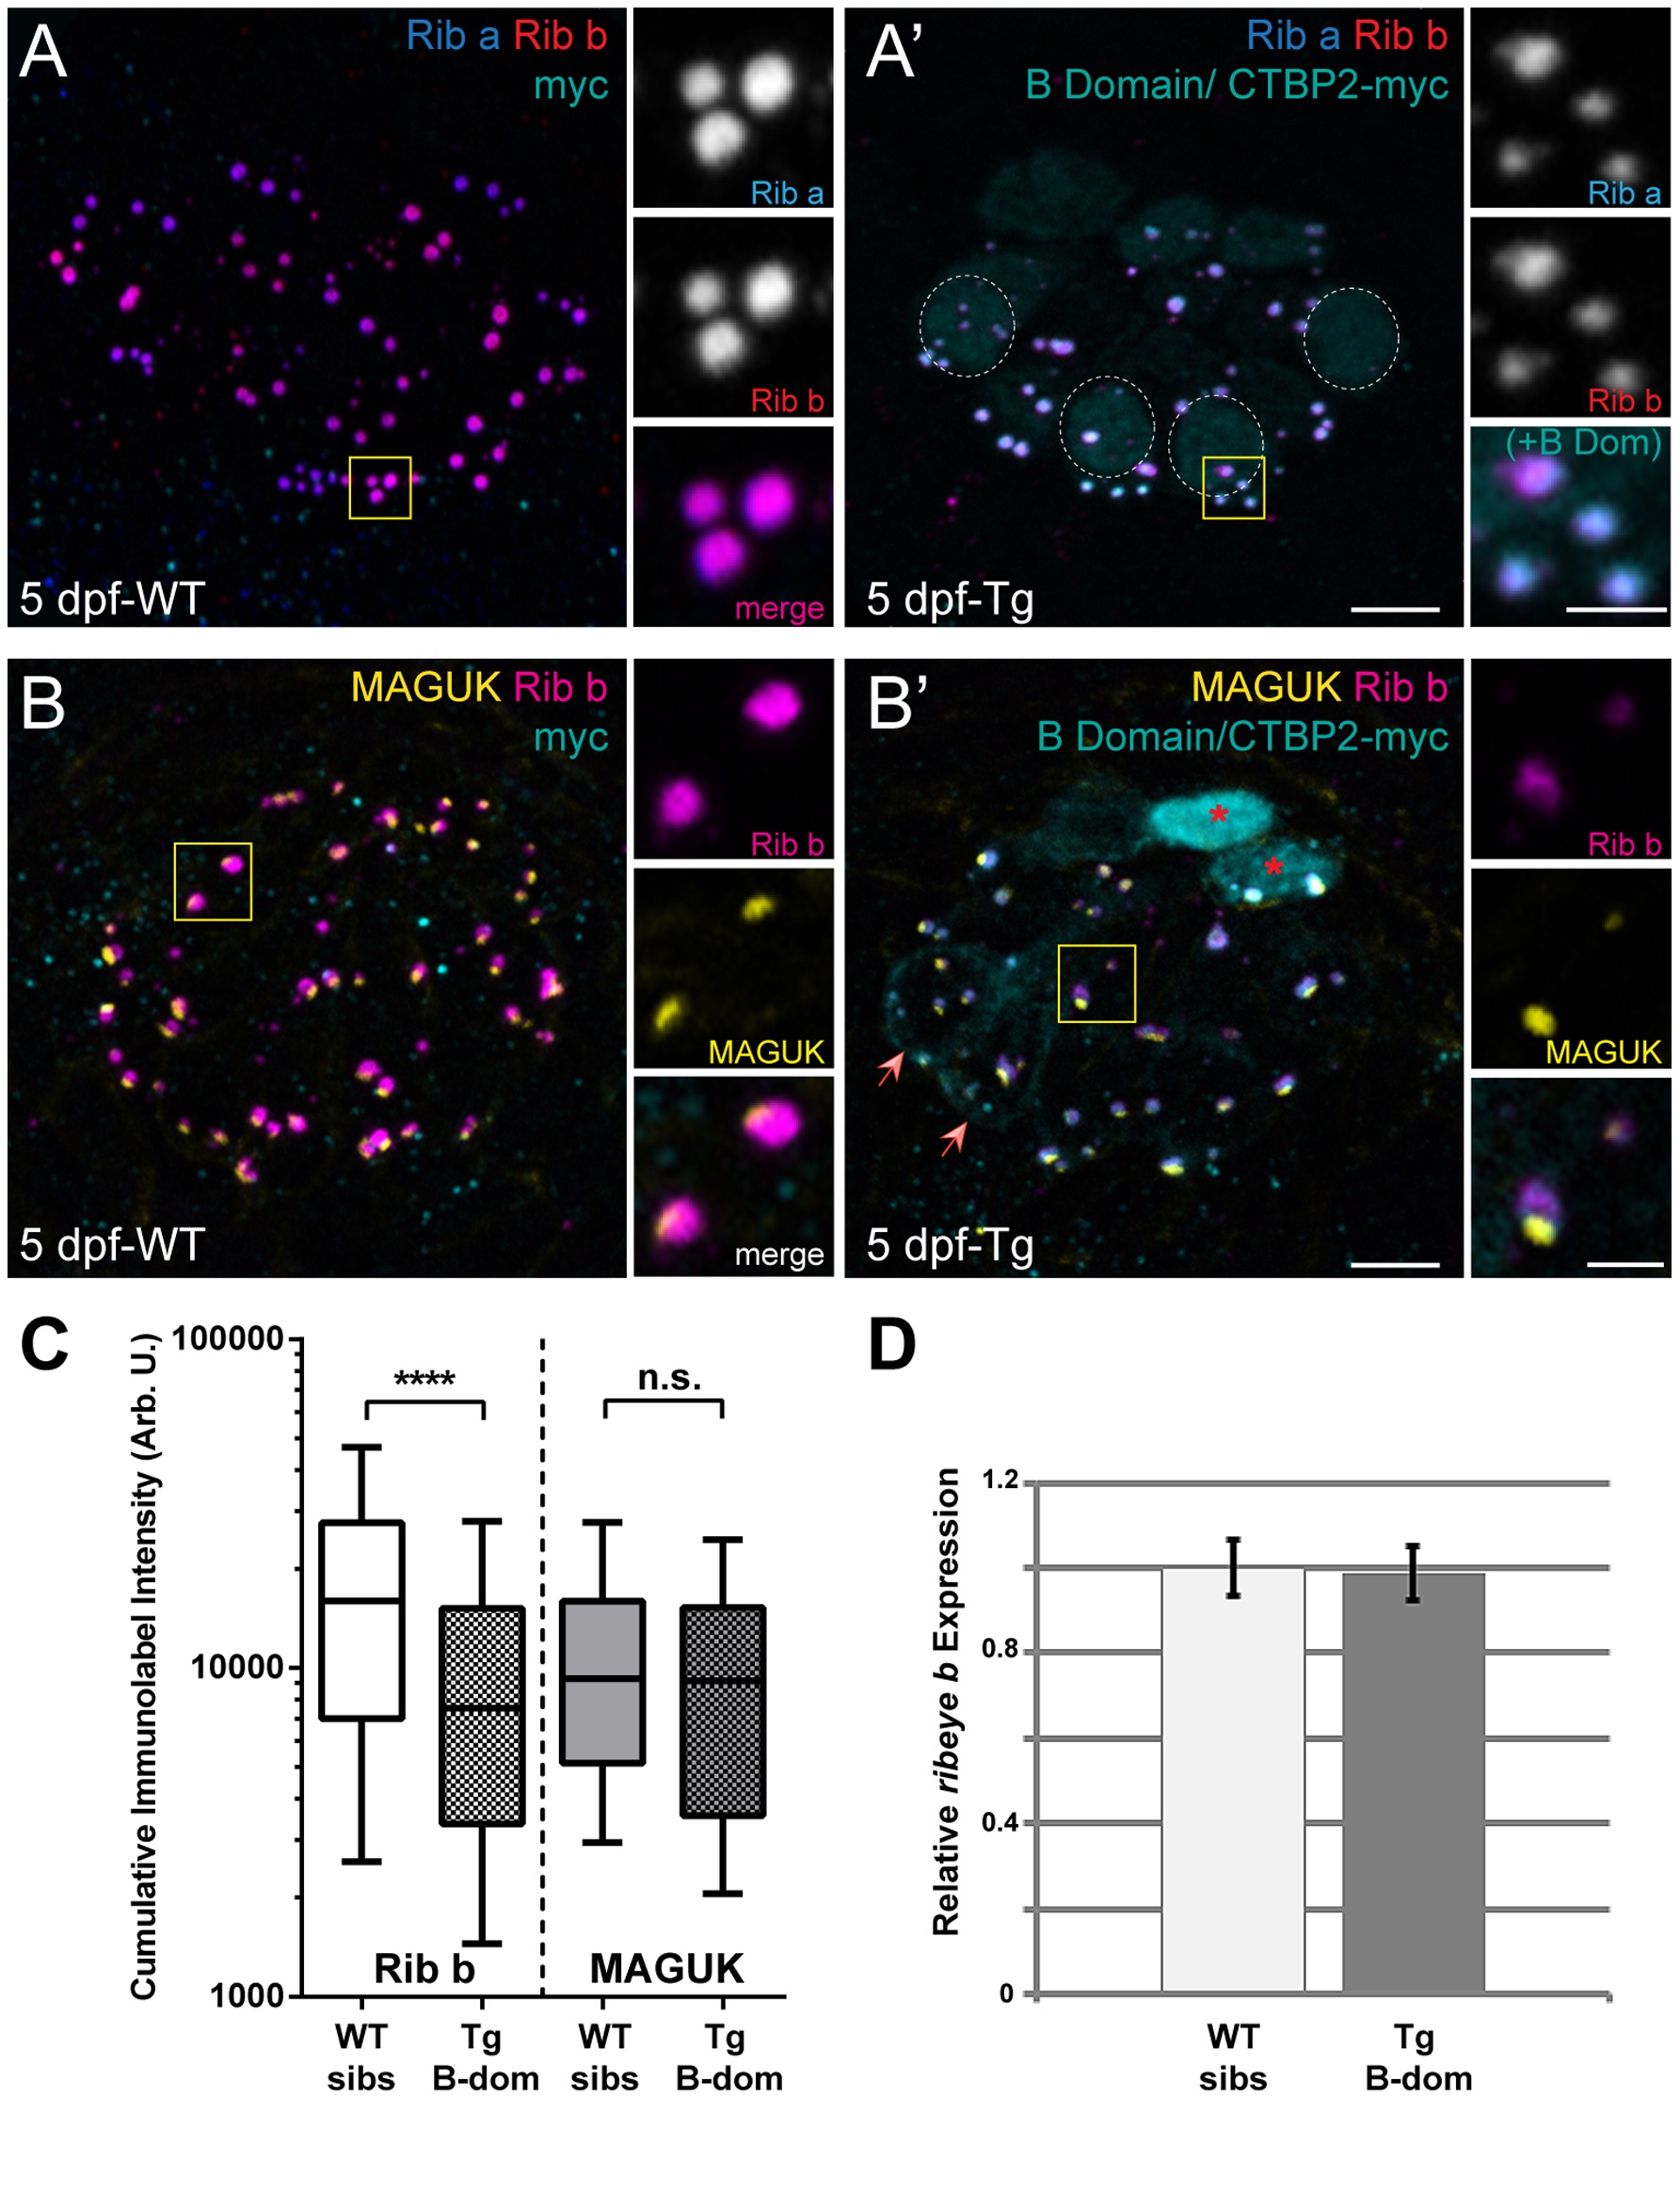
Fig. 4 Ribeye B-domain/CtBP2s disrupts endogenous Ribeye retention at synaptic ribbons in 5 dpf hair cells.
(A-B) Representative images of immunolabel or fluorescent tag in posterior lateral line NM3 hair cells of 5 dpf larvae. Scale bars: 3 μm (main panels), 1 μm (insets). (A, A′) Ribeye a (blue) and Ribeye b (red) antibody labeling of synaptic ribbons, and anti-myc antibody labeling of B domain-myc (cyan) in a WT (A) and a transgenic (A′) larva. Dashed circles indicate weak nuclear localization of B-domain. (B, B’) Ribeye (B-domain)-myc (cyan), Ribeye b (magenta), and MAGUK (yellow) immunolabel in a WT (B) and a transgenic (B′) larva. Red asterisks indicate strong nuclear localization of B-domain. Red arrows indicate cells with moderate levels of B-domain in the cytosol. (C) Box plots of cumulative immunolabel intensities of presynaptic Ribeye immunolabeled spheres and postsynaptic MAGUK immunolabeled patches in 5 dpf transgenic B domain-myc larvae and WT siblings. These plots show the median value (horizontal bar), the upper and lower quartiles (box), and the range (whiskers). Whiskers indicate the 10th and 90th percentiles. ****P<0.0001, defined by a Mann-Whitney U Test. Each plot represents a population of intensity measurements collected from NM3 hair cells of 7–8 individual larvae. (D) Relative expression level of ribeye b transcripts in the posterior lateral line of 5 dpf transgenic B domain-myc larvae and WT siblings. Expression data was normalized to b-actin expression. The level of gene expression in WT siblings was normalized to one. Error bars are s.e.m.