
Fig. 5
- ID
- ZDB-IMAGE-150116-27
- Publication
- Benard et al., 2014 - Phagocytosis of mycobacteria by zebrafish macrophages is dependent on the scavenger receptor Marco, a key control factor of pro-inflammatory signalling
- All Figures
- Figures for Benard et al., 2014
|
Fig. 5
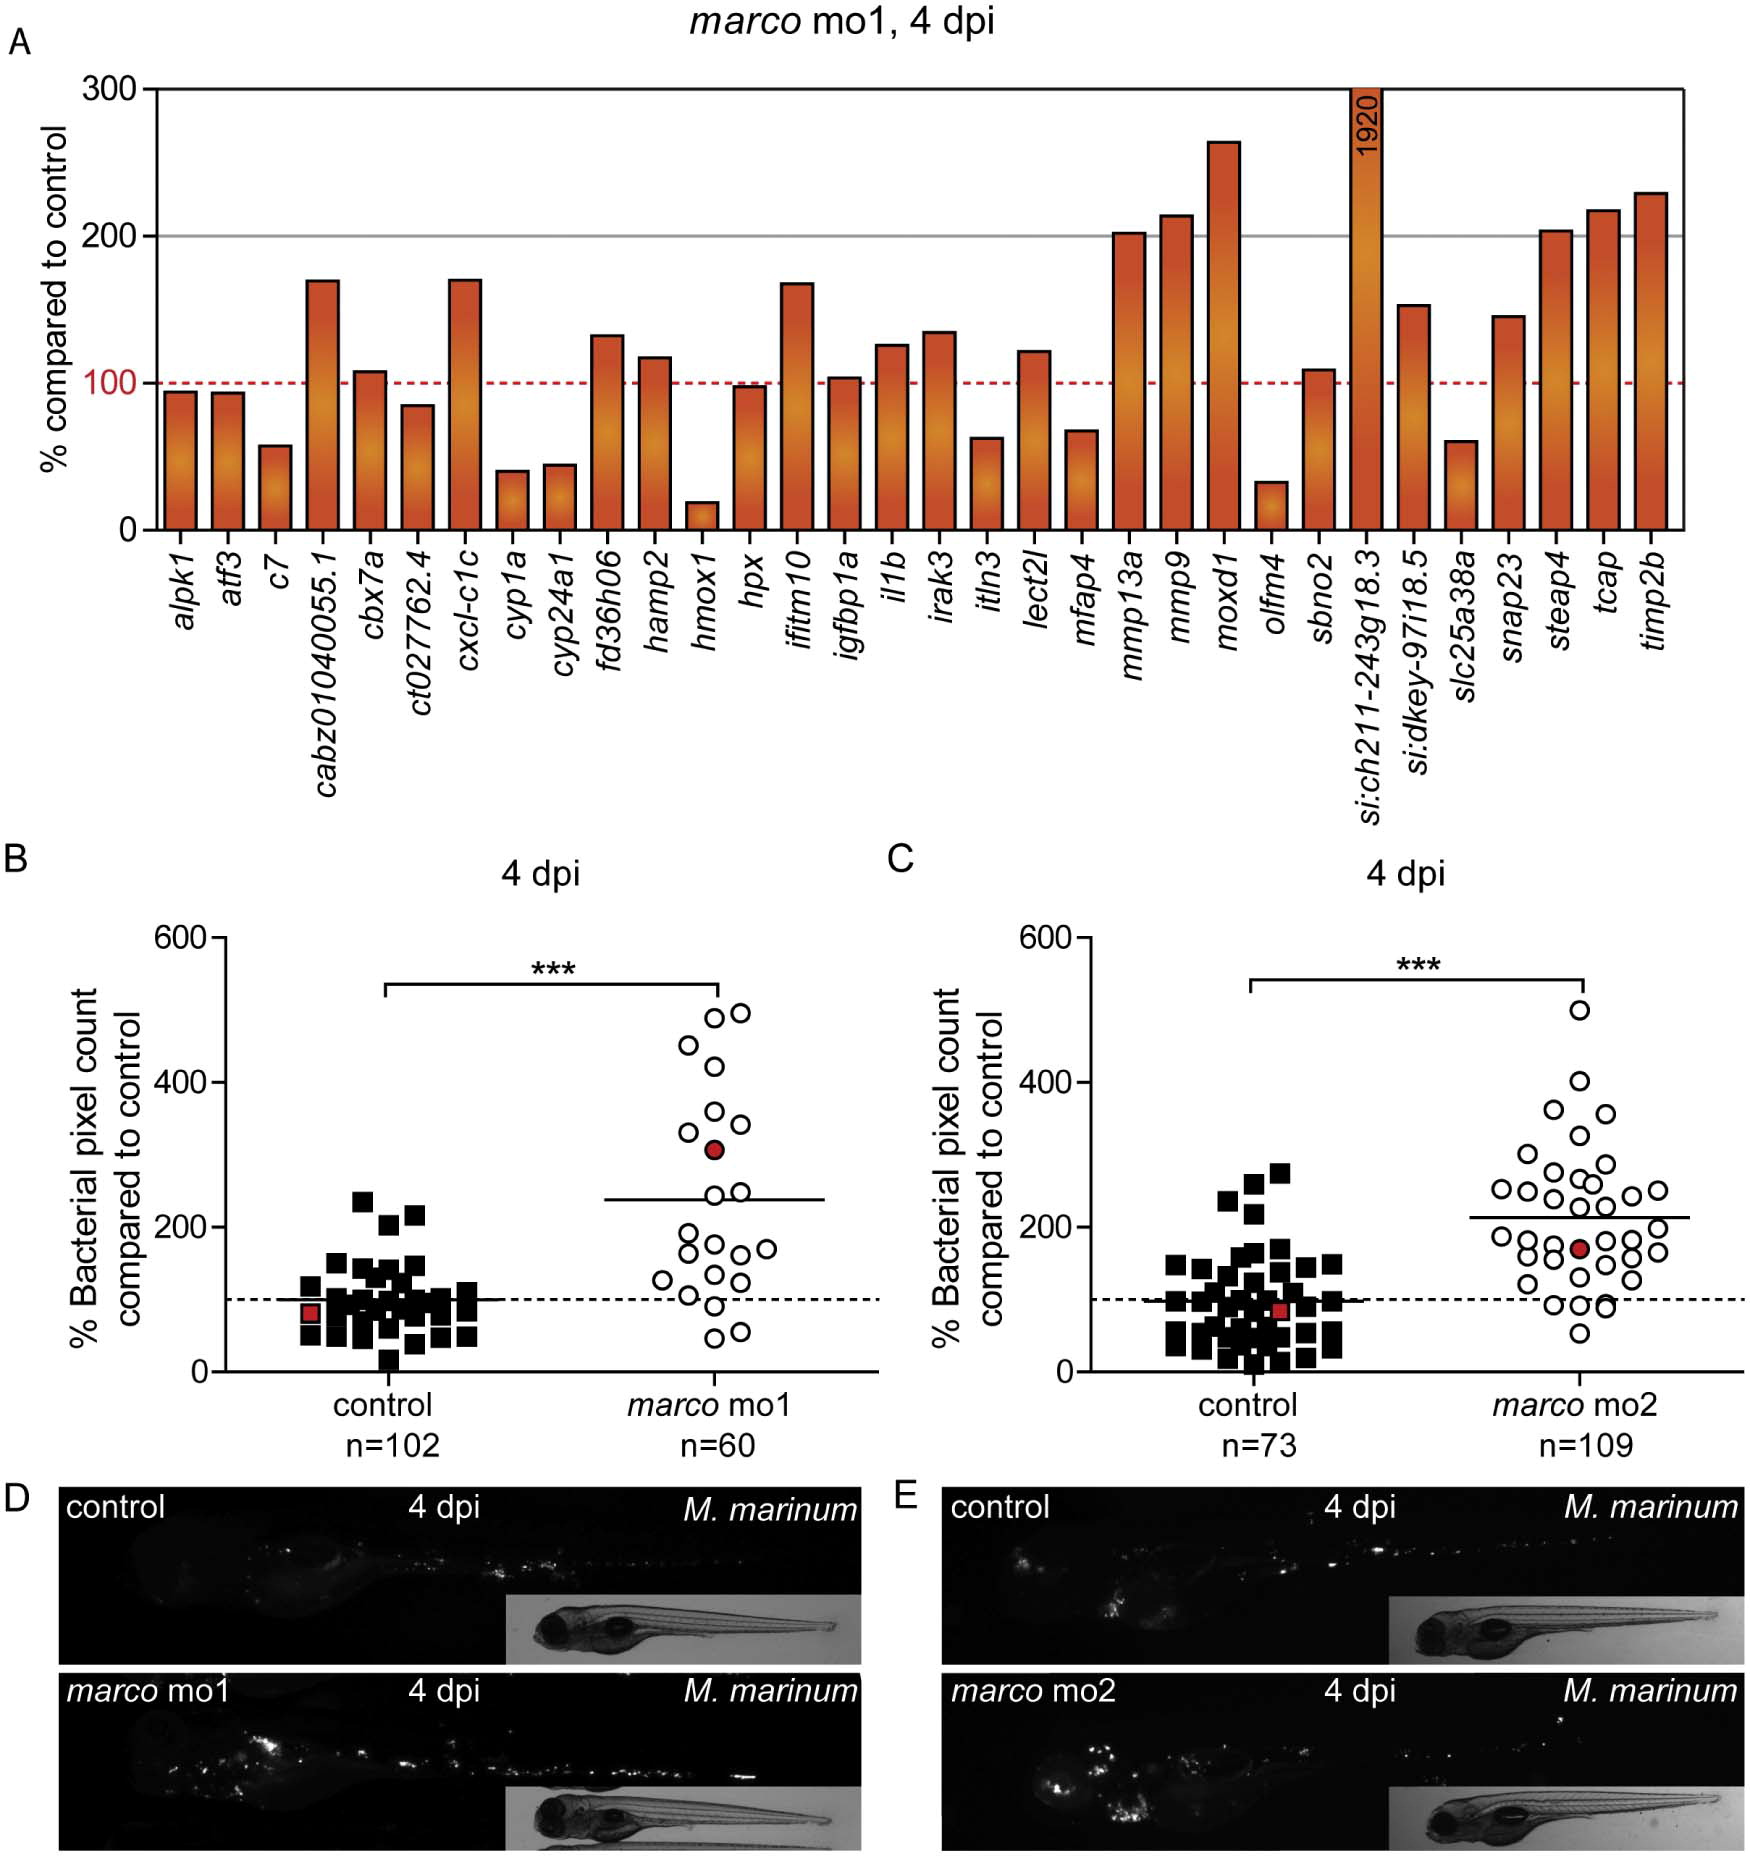
Effect of marco knockdown on the innate immune response and control of M. marinum infection. (A) Graph of the percentage of expression levels of infected marco mo1 morphants compared to infected control embryos on a set of 32 genes that showed reproducible induction by M. marinum infection in control embryos. The expression level of these genes under conditions of marco deficiency is expressed as the percentage of the expression level in the corresponding control. Results are based on RNA-Seq analysis of pools of 30 infected and 30 uninfected embryos for each group. Embryos were injected with M. marinum (200 cfu) or mock injected with 2% PVP, and RNA-Seq analysis was performed at 4 dpi. (B–E) marco knockdown impairs control of M. marinum infection. AB/TL embryos were injected with two different splice blocking morpholinos against (A–D) marco or with control morpholino, subsequently injected with mCherry-expressing M. marinum, and infected embryos were imaged at 4 dpi. (B,C) Bacterial burden was quantified by determining the number of fluorescent bacterial pixels and (D,E) representative stereo fluorescent images are shown below the graph of each experiment. Red symbols indicate which individuals are shown below as representative images. Graphs show combined results of 3 repeated independent experiments. Each data point represents an individual embryo.