
|
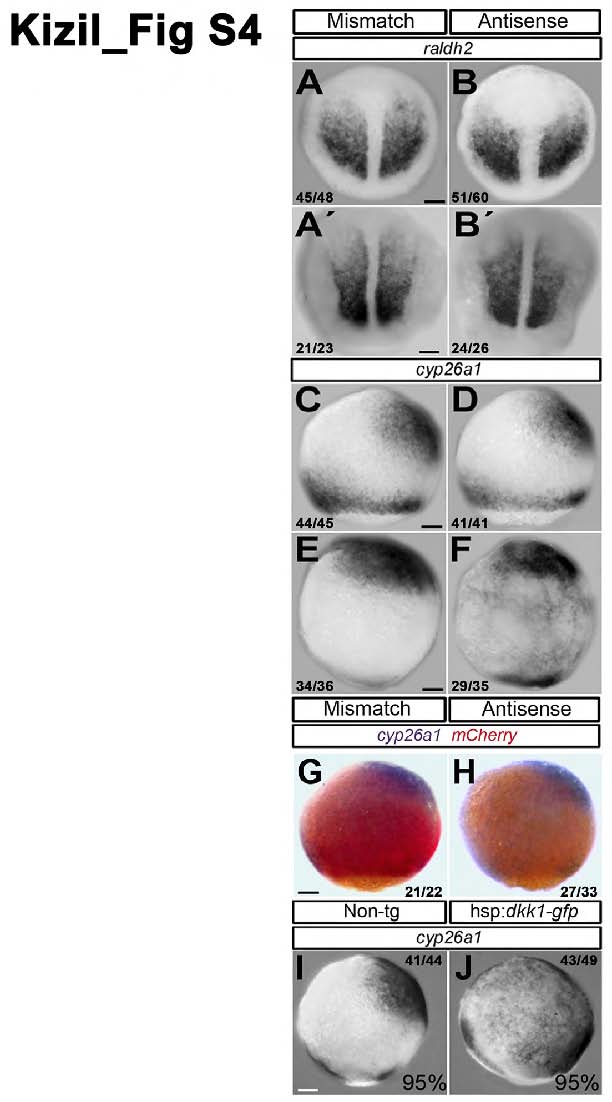
Fig. S4 Altered cyp26a1 expression in smp morphants, Related to Figure 1. (A) raldh2 expression in the paraxial mesoderm of mismatch controls at tailbud (A) and 2-somite stage (A′) embryos. (B) raldh2 expression in smp morphants at tailbud (B) and 2-somite stage (B′). (C) cyp26a1 in the margin and the presumptive brain of controls at 95% epiboly. (D) smp morphants have similar expression at the same stage. (E) At tailbud stage, controls had cyp26a1 expression in the anterior pole. (F) smp morphants showed expansion of cyp26a1 expression. (G) cyp26a1 expression (blue) and 7xTCF-XLa.Siam:nlsmCherry reporter expression (red) in controls at 95% epiboly. (H) cyp26a1 expression does not change at 95% epiboly in antisense-morphant embryos, while mCherry expression (Wnt signaling) is reduced. (I) cyp26a1 expression at 95% epiboly in non-transgenic embryos after heat shock at 60% epiboly. (J) Expanded expression of cyp26a1 at 95% epiboly in embryos harboring the hsp70:dkk-1-GFP transgene after heat shock at 60% epiboly. Numbers in the lower left corners in panels indicate the number of embryos with the depicted expression patterns to the total number of embryos. Scale bars: 100 μm.