
|
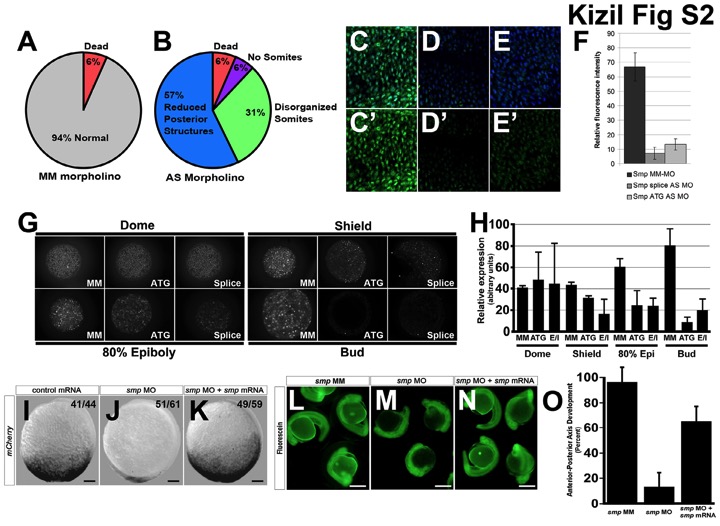
Fig. S2
Characterisation of smp morpholinos, Related to Figure 1.(A) 94% of the embryos injected with the mismatch morpholino control for smp did not show a noticeable phenotype. (B) Knockdown of smp produced a majority of embryos lacking posterior structures, 31% that showed somites of different sizes, 6% that partially developed up to the start of somitogenesis and 6% that dead before somitogenesis. (C-E) Immunohistochemistry for zebrafish Smp in zebrafish embryos using the rabbit anti-zebrafish Smp (zSmp) polyclonal antibody and DAPI staining on mismatch smp control injected (C), antisense smp ATG morphant (D) and antisense smp splice site morphant embryos (E). (C′-D′) Immunostainings without DAPI staining. (F) Graph of the measurements of the staining levels of staining by the rabbit anti-zSmp polyclonal antibody of each injected morpholino group. (G) Expression of maternally loaded protein at different stages of development and effect on protein expression after morpholino knockdown (MM) Mismatch, (ATG) ATG morpholino, (Splice) Splice-site morpholino. (H) Quantitation of maternal protein expression profiles. (I) 7xTCF-mCherry activity at 95% epiboly after injection of GFP mRNA in the one-cell embryo. (J) 7xTCF-XLa.Siam:nlsmCherry activity in smp morphant. (K) 7xTCFXLa. Siam:nlsmCherry activity after co-injection of smp mRNA with smp morpholino. (L) 24 hour zebrafish embryos with fluorescein-labeled mismatch morpholino for smp show no developmental phenotype. (M) Knockdown of smp with a fluorescein-labeled morpholino shows severe axis anterior-posterior axis defects. (N) Rescue of knockdown phenotype when smp mRNA is co-injected with smp antisense morpholino. (O) Graph depicts quantitative assessment of the anterior-posterior axis phenotype by smp mRNA. Numbers in the lower left corners in panels (I-K) indicate the number of embryos with the depicted expression patterns to the total number of embryos. Scale bars are 50 μm (I-K) and 300 μm (L-N).