
|
Fig. 3
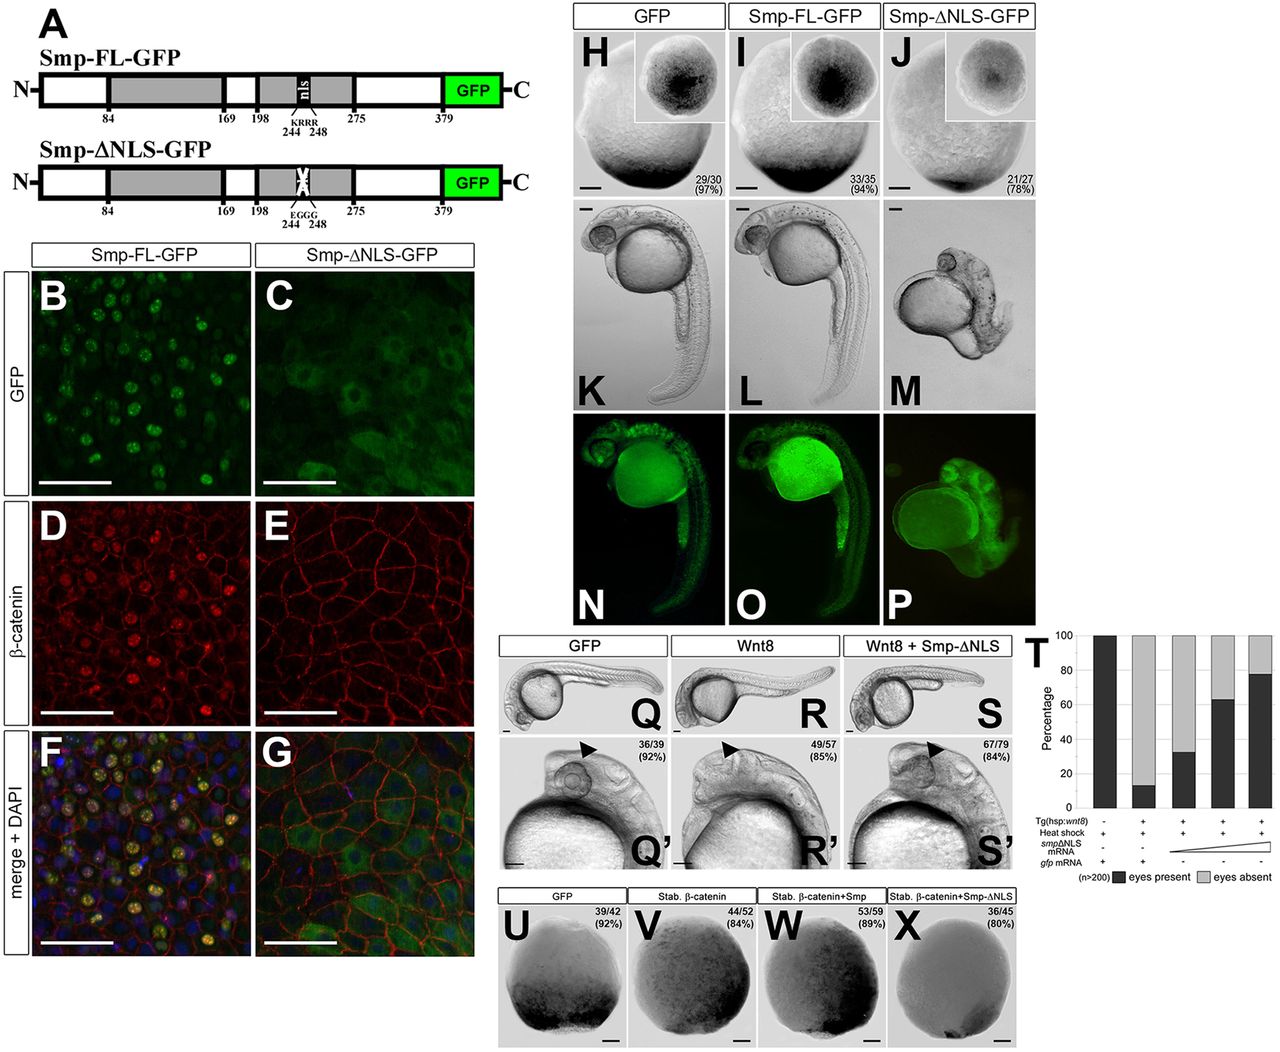
Nuclear localization of β-catenin requires the Smp nuclear localization signal. (A) The domain structure of Smp. The two grey boxes indicate regions of significant conservation among vertebrates. The numbers indicate the position of the amino acids. ‘nls’ identifies the nuclear localization signal KRRR. Substitution of these amino acids with EGGG ablates the nuclear localization signal (white cross). (B) Overexpression of Smp-GFP in fish embryos. (C) Deletion of the nuclear localization signal in Smp-GFP. (D) Co-staining for β-catenin in Smp-GFP-injected embryo. (E) Co-staining for β-catenin in Smp-ΔNLS-GFP-injected embryo. (F) Overlay of Smp-GFP and β-catenin immunostainings in Smp-GFP-injected embryo. (G) Overlay of Smp-GFP and &neta;-catenin immunostaining in Smp-ΔNLS-GFP-injected embryo. (H-J) Overexpression of GFP (H), Smp-FL (I) or Smp-ΔNLS (J) in the Tg(7xTCF:mCherry) embryos at tailbud stage. (K) Overexpression of GFP in a 24hpf embryos. (L) Overexpression of Smp-GFP in 24hpf embryo. (M) Overexpression of Smp-ΔNLS-GFP in 24dpf embryo. (N-P) Expression of each GFP-fused construct in the injected embryos. (Q,Q2) Control-injected transgenic embryos at 24hpf. (R,R′) Transgenic overexpression of wnt8. (S,S′) Injection of smp-ΔNLS into embryos transgenically overexpressing wnt8. Arrowheads indicate the expected location of the developing eye. (T) Graph shows a direct correlation between the rescue from the wnt8-overexpression posteriorization phenotype and the amount of smp-ΔNLS mRNA injected. Data are the average percent. (U) Control-injected Tg(7xTCF:mCherry) embryos. (V) Injection of mRNA encoding stabilized β-catenin. (W) Co-injection of mRNAs for stabilized β-catenin and Smp-FL. (X) Overexpression of Smp-ΔNLS with stabilized β-catenin. Numbers in the lower or upper right panel corners represent number of embryos with the observed phenotype/the total number of embryos (also represented as a percentage). Scale bars: 50μm in B-G; 100μm in H-X. Numbers in the lower or upper right corners indicate the number of embryos with the depicted expression patterns/the total number of embryos.