
|
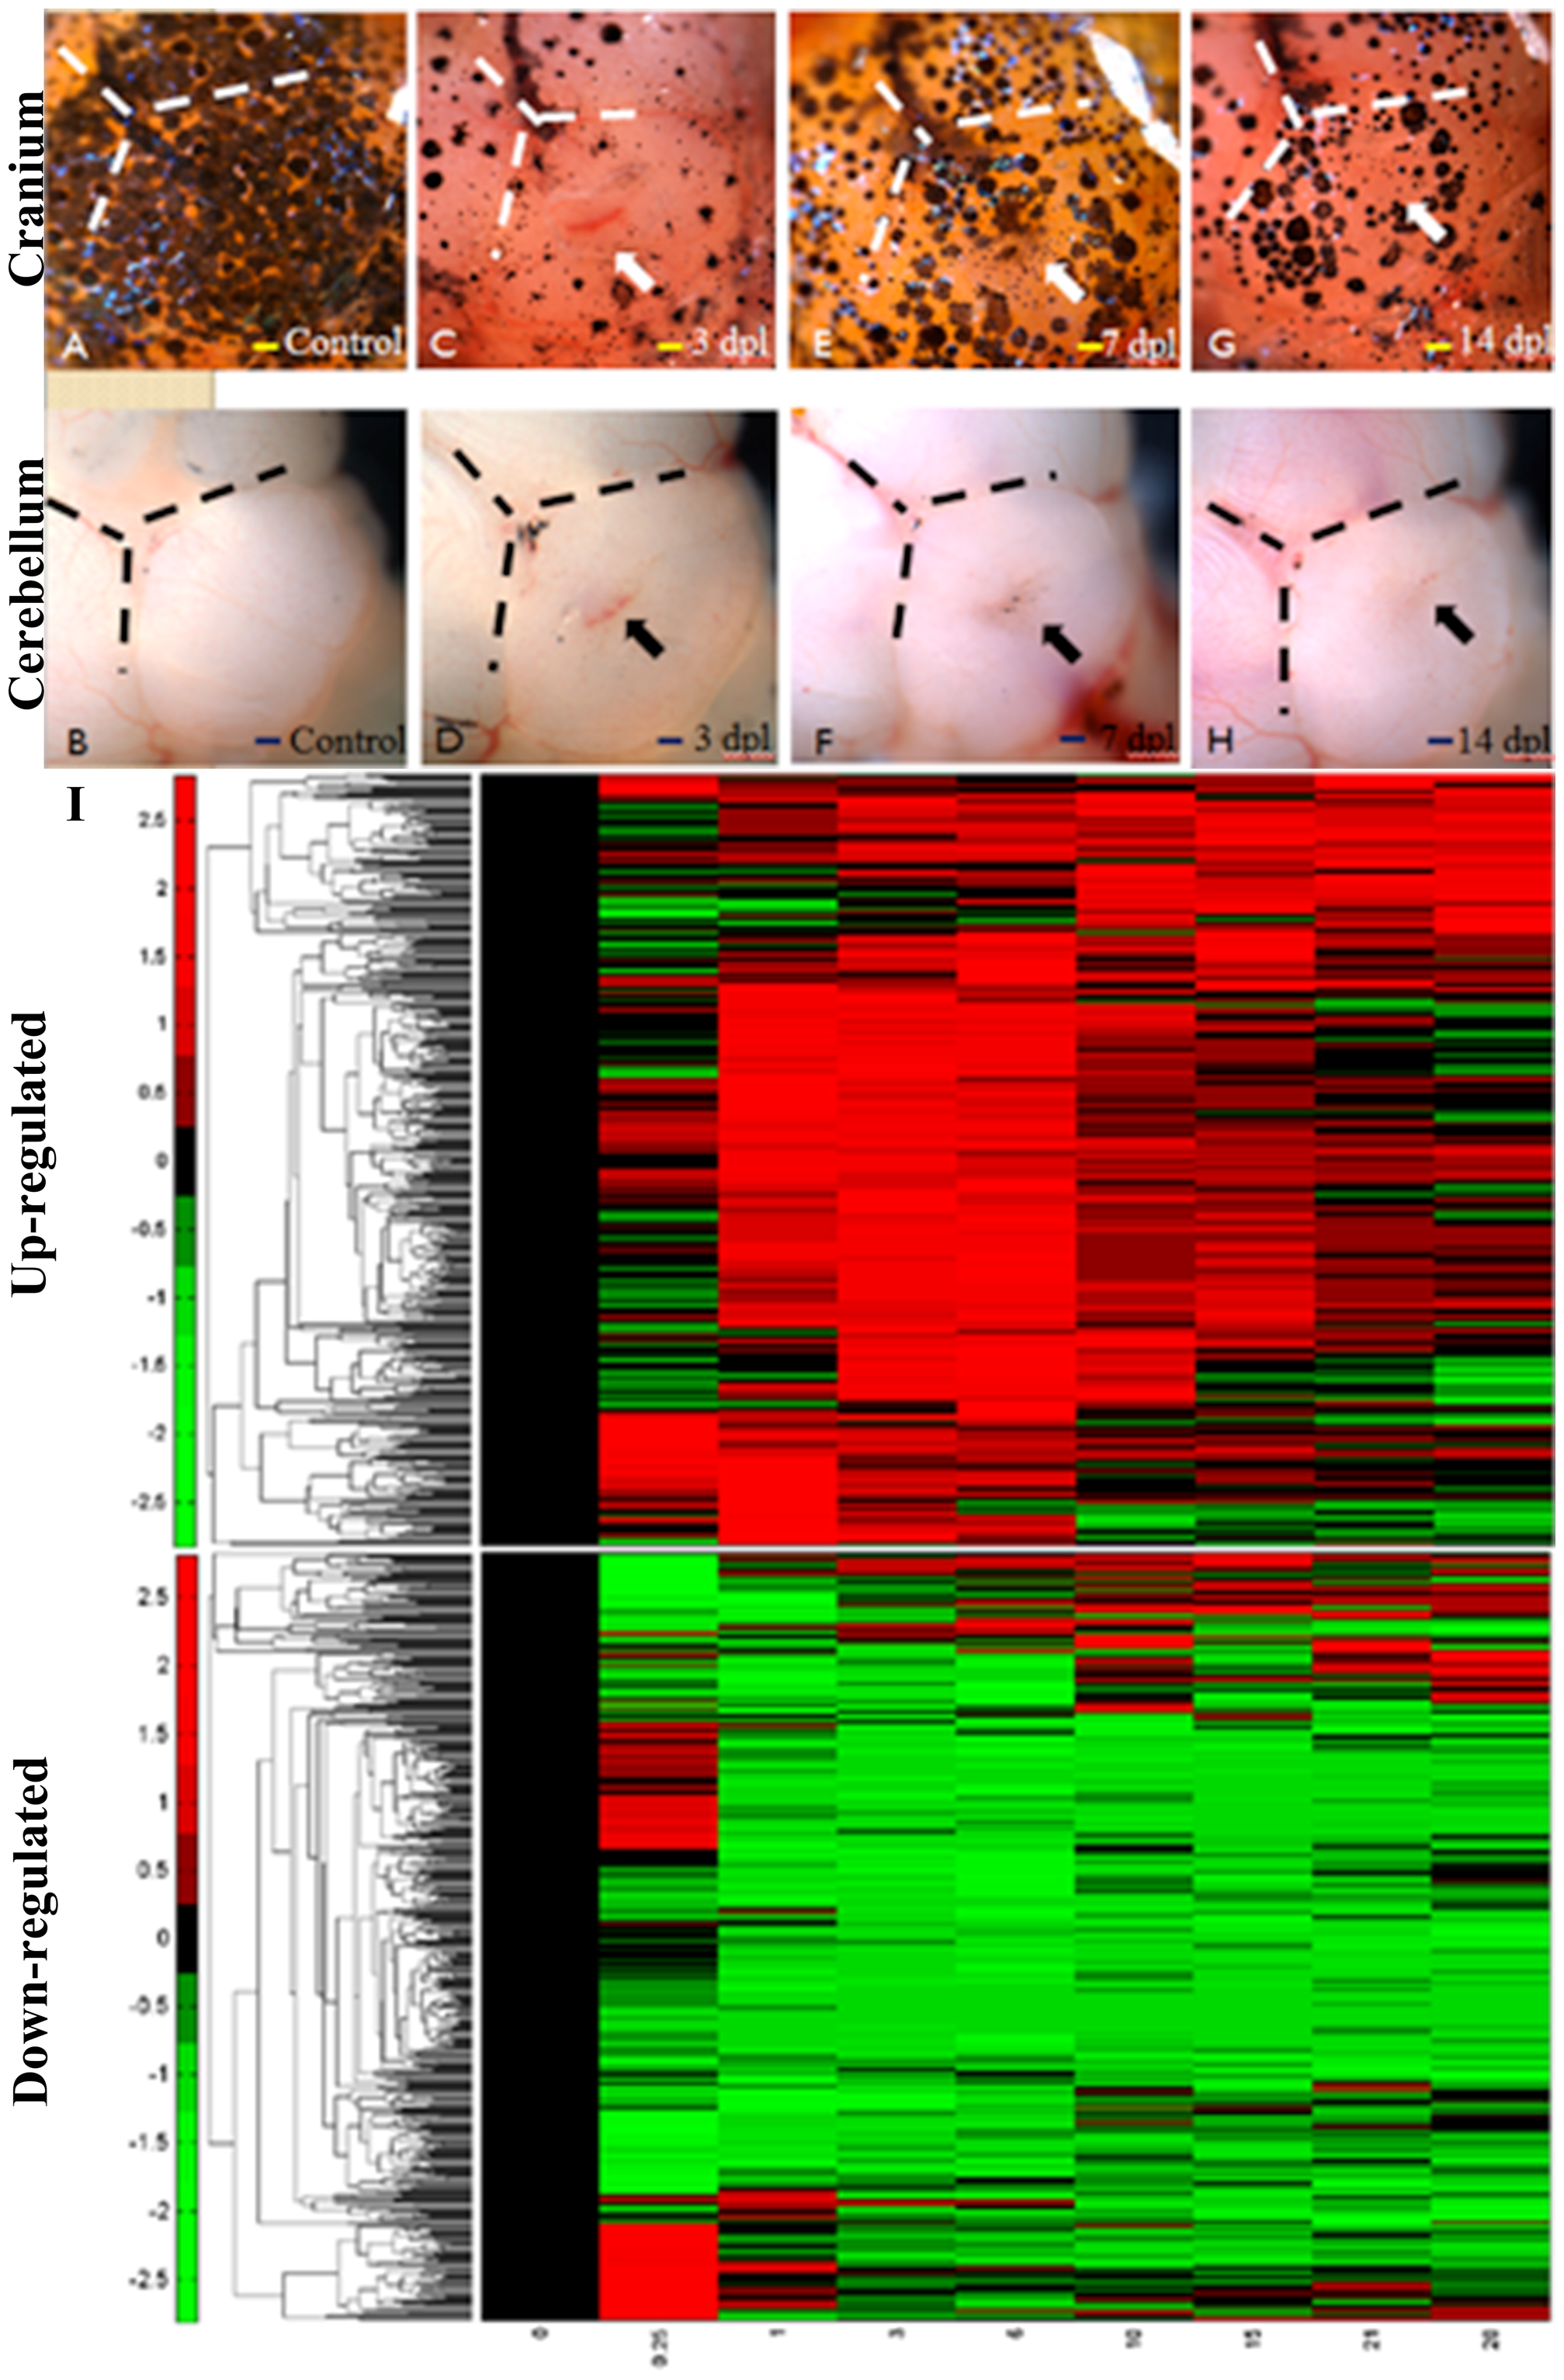
Fig. 2
Regeneration of cerebellum at different day-post-lesion and the time-course microarray data in cerebellar wound healing process.
A-H: Bright field images of the craniums (A, C, E, G) and cerebellums (B, D, F, H) at different time points post lesion. The cranial and cerebellum were intact before stab lesion (A, B). At 3dpl, the wound can be seen on the cranial and cerebellum. (C, D) At 7dpl, the cranial is seal and scar is observed in the cerebellum. (E, F) At 14 dpl, the scar was hardly seen. (Scale bar, 100 μm.). (I) The differentially expressed genes (≥1.5 or ≤0.67 fold change) are hierarchically clustered (5839 genes). Columns represent the day-post-lesion (dpl), and the rows represent the genes. The blocks indicate temporally up-regulated and down-regulated genes, respectively. The color bar represents the log value of the ratio relative to the intensity at 0 dpl.