
Image
|
Figure Caption
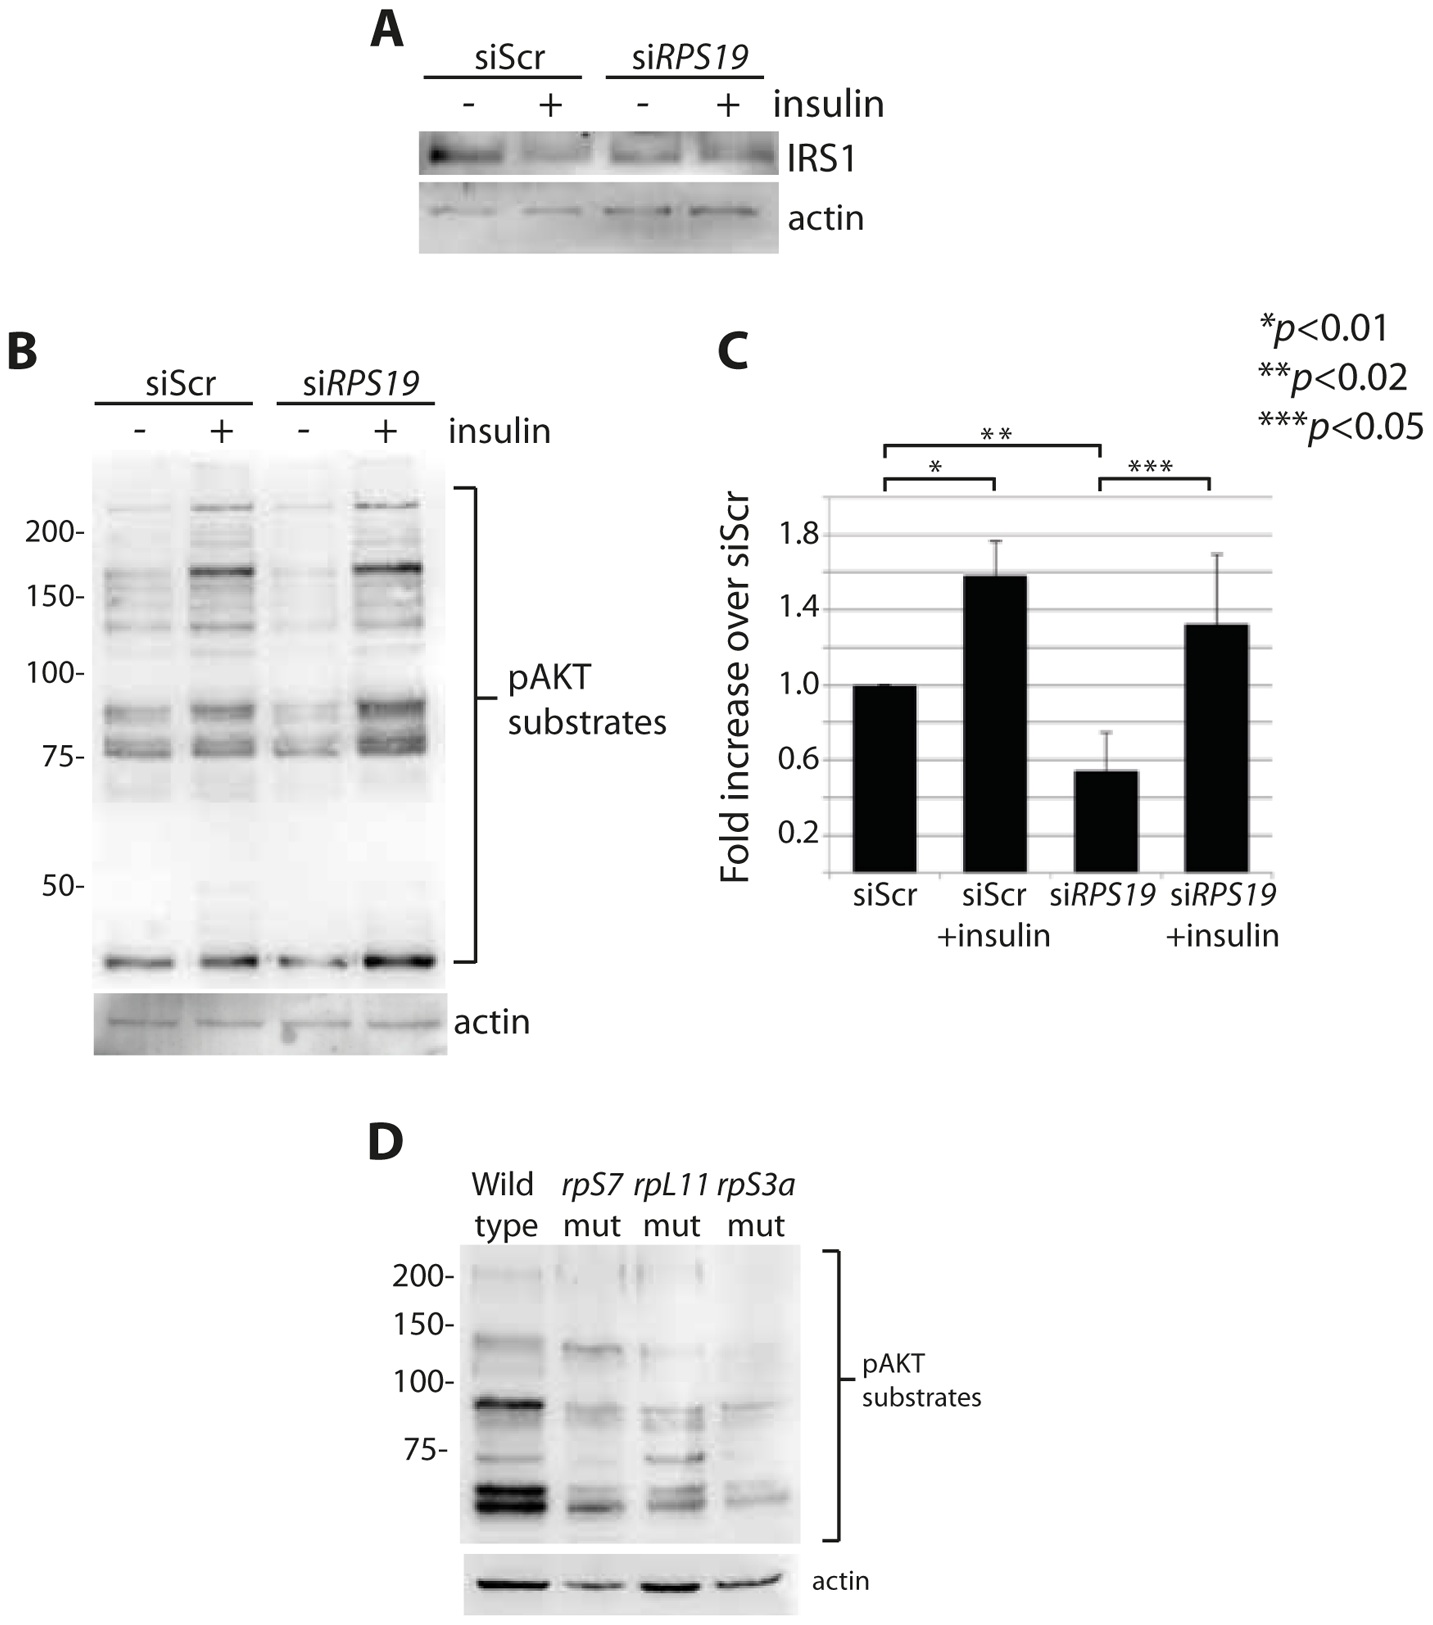
Fig. 5 RP loss results in a decrease of IRS1 and phosphorylated AKT substrates. (A) Western blot analysis of IRS1 in GFP-LC3 HEK cells transfected with siScr or siRPS19. (B) Western blot analysis of phosphorylated AKT substrates in GFP-LC3 HEK cells transfected with siScr or siRPS19 and either untreated or stimulated with 350 nM insulin for 6 hours. (C) Densitometer analysis of the total expression level of phosphorylated AKT substrates in (B). (D) Western blot analysis of phosphorylated AKT substrates in 2 dpf zebrafish embryos.
Figure Data
Acknowledgments
This image is the copyrighted work of the attributed author or publisher, and
ZFIN has permission only to display this image to its users.
Additional permissions should be obtained from the applicable author or publisher of the image.
Full text @ PLoS Genet.