
Fig. S7
- ID
- ZDB-IMAGE-140903-44
- Publication
- Schiavone et al., 2014 - Zebrafish reporter lines reveal in vivo signaling pathway activities involved in pancreatic cancer
- All Figures
- Figures for Schiavone et al., 2014
|
Fig. S7
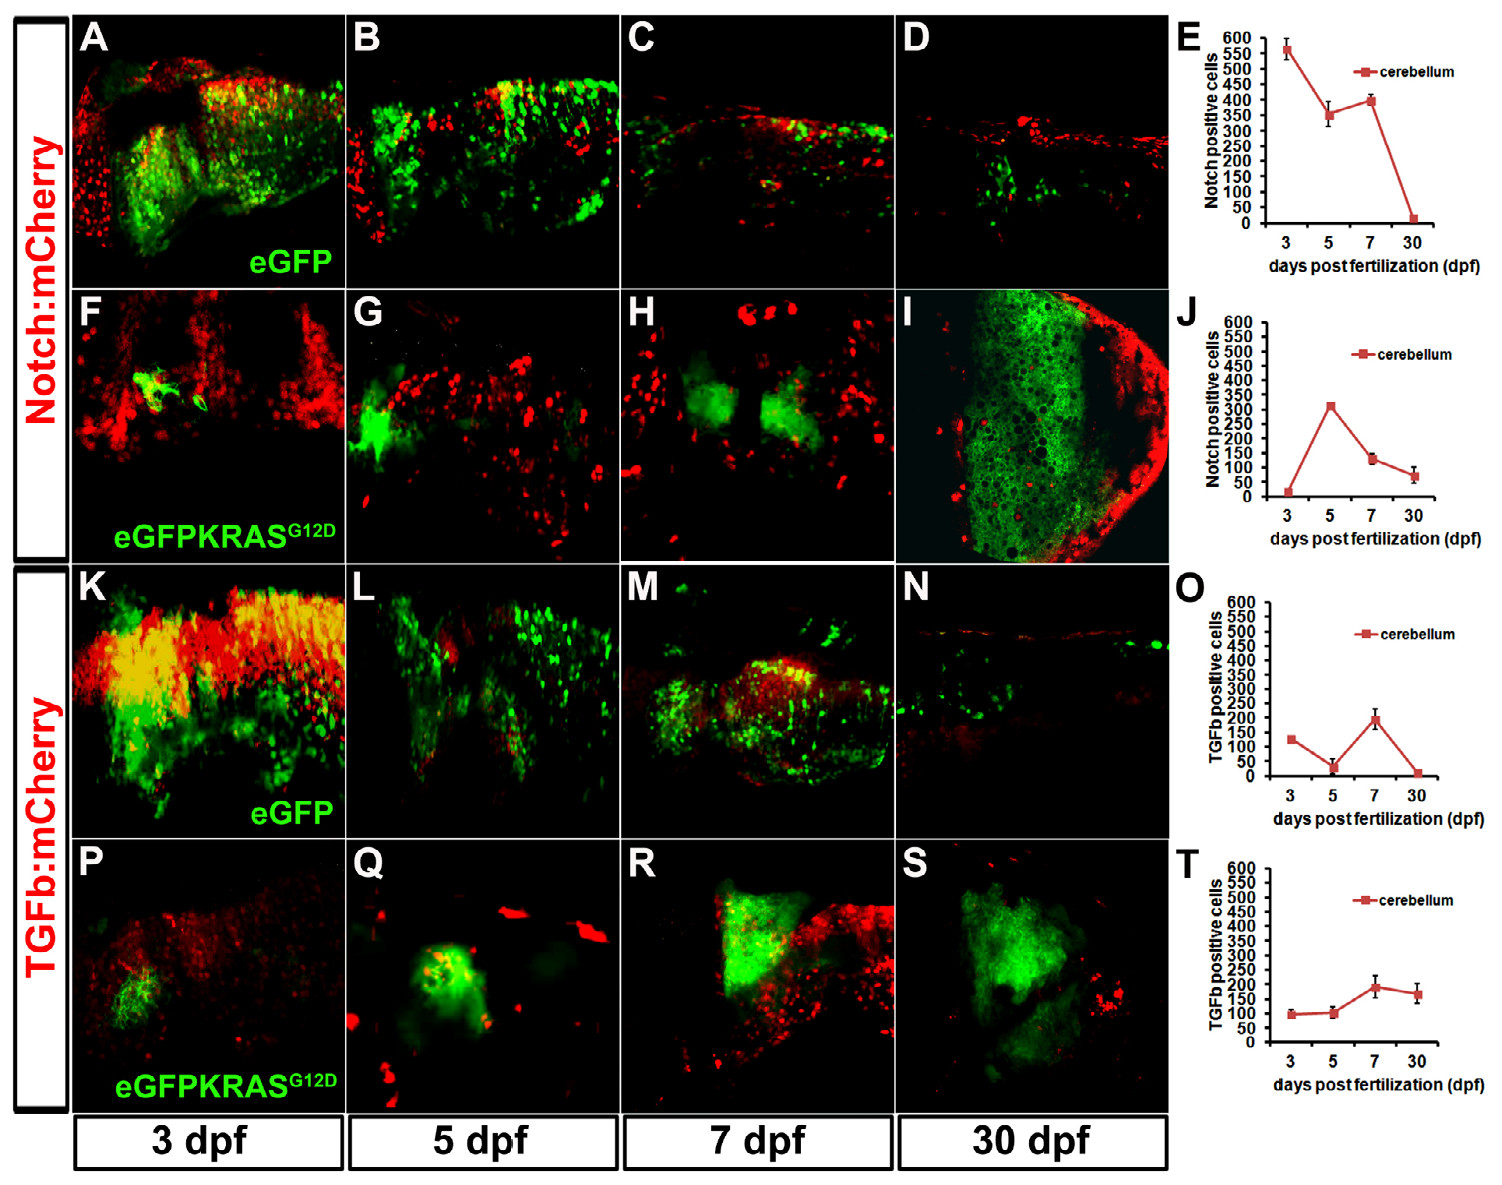
Role of Notch and TGFβ pathways during MDB onset and progression. Confocal analysis was performed to dissect the role of Notch and TGFβ pathways during MDB development. A-D: activity of Notch signaling pathway (red signals) in normal cerebellum (in green). E: Graph displaying the strong decrease of Notch:mCherry signal during development. F-J: inhibition of canonical Notch pathway (red signals) during MDB onset (3 - 7 dpf; F-H) and very low activity during MDB progression (30 dpf; I), as depicted also in graph (J), in parallel with the strong enlargement of eGFPKRASG12D tumor masses (green signals). Panels K-N display the activity of TGFβ signaling pathway (red signals) in MDB-free conditions. The alternating behavior of TGFβ:mCherry reporter line is depicted in graph (O). P-T: Increase of TGFβ signaling pathway (red signals) in MDB onset (3–7 dpf; P-R) and its involvement during MDB progression (S), as also depicted in graph T. Scale bar in all images is 50 μm, as reported in panel A. T student analysis showed P < 0.005, indicating that differences between MDB and control samples are statistically significant. Error bars are reported in each graph. Results in E, J, O, T are reported as eGFP/mCherry positive cell number.