
IMAGE
Fig. S1
- ID
- ZDB-IMAGE-140903-33
- Publication
- Heijnen et al., 2014 - Ribosomal Protein Mutations Induce Autophagy through S6 Kinase Inhibition of the Insulin Pathway
- All Figures
- Figures for Heijnen et al., 2014
Image
|
Figure Caption
Fig. S1
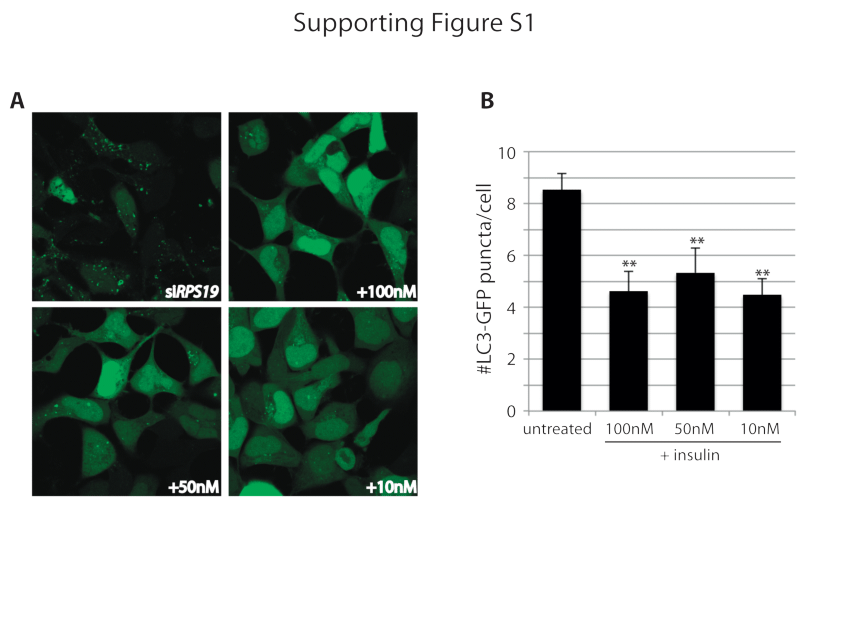
(A) Confocal analysis of LC3-GFP expressing HEK cells transfected with siRNAs against RPS19 and either untreated (upper left) or treated overnight with 10, 50, or 100nM insulin. (B) Quantification of the number of LC3-GFP positive puncta per cell. **p<0.01.
Acknowledgments
This image is the copyrighted work of the attributed author or publisher, and
ZFIN has permission only to display this image to its users.
Additional permissions should be obtained from the applicable author or publisher of the image.
Full text @ PLoS Genet.