
|
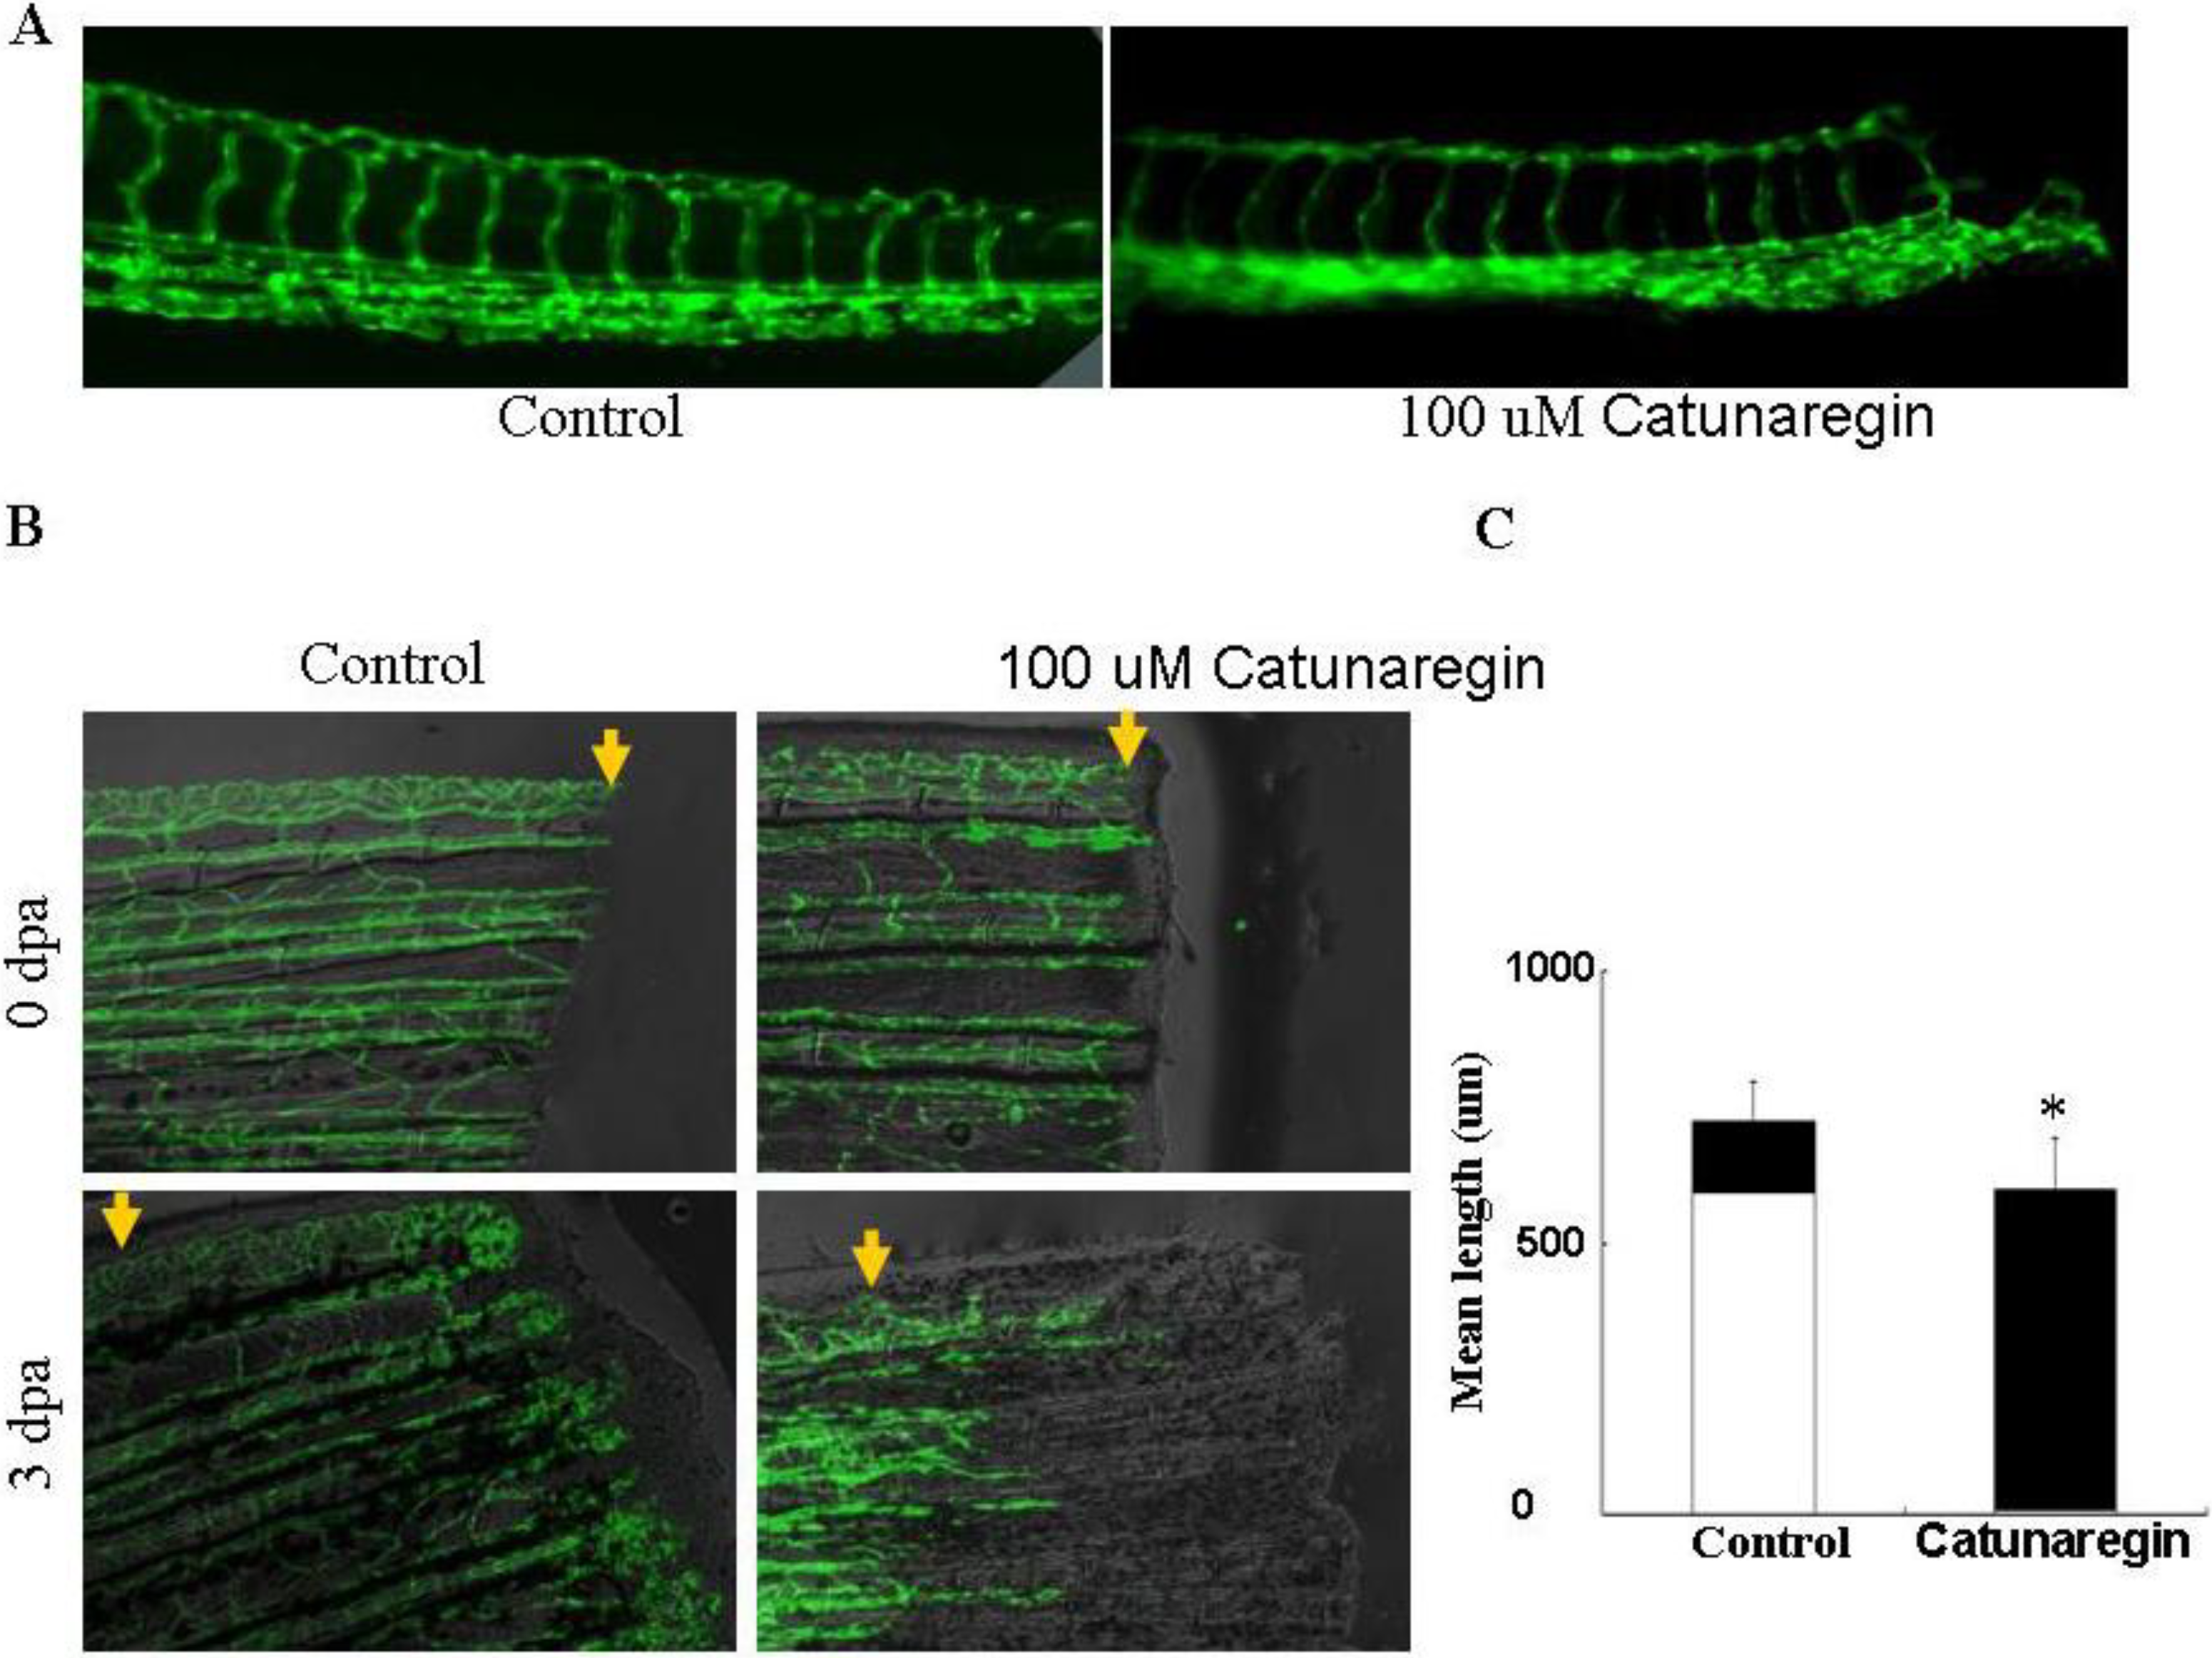
Fig. 5
Inhibition of the zebrafish neovascularization by catunaregin. (A) Live fluorescent zebrafish embryo assay. Transgenic TG (fli1:EGFP) zebrafish embryos, which show green fluorescent protein (GFP) expression in endothelial cells, were incubated for 72 h without or with 100 μM catunaregin. (B) Caudal fin regrowth is limited by angiogenesis. The same fins are shown in bright field (top panels) and with the corresponding endothelial-eGFP signal (bottom panels). Zebrafish tail fins were clipped, then allowed to recover normally or treated with catunaregin as indicated. (C) Quantitative comparison of vessel and fin regeneration in control and catunaregin-treated fish. Black bars, nonvascularized fin tissue; white bars, vascularized tissue. Average values are plotted for fin and vessel growth (n = 15) (* catunaregin vs. control, p < 0.01).