
Image
|
Figure Caption
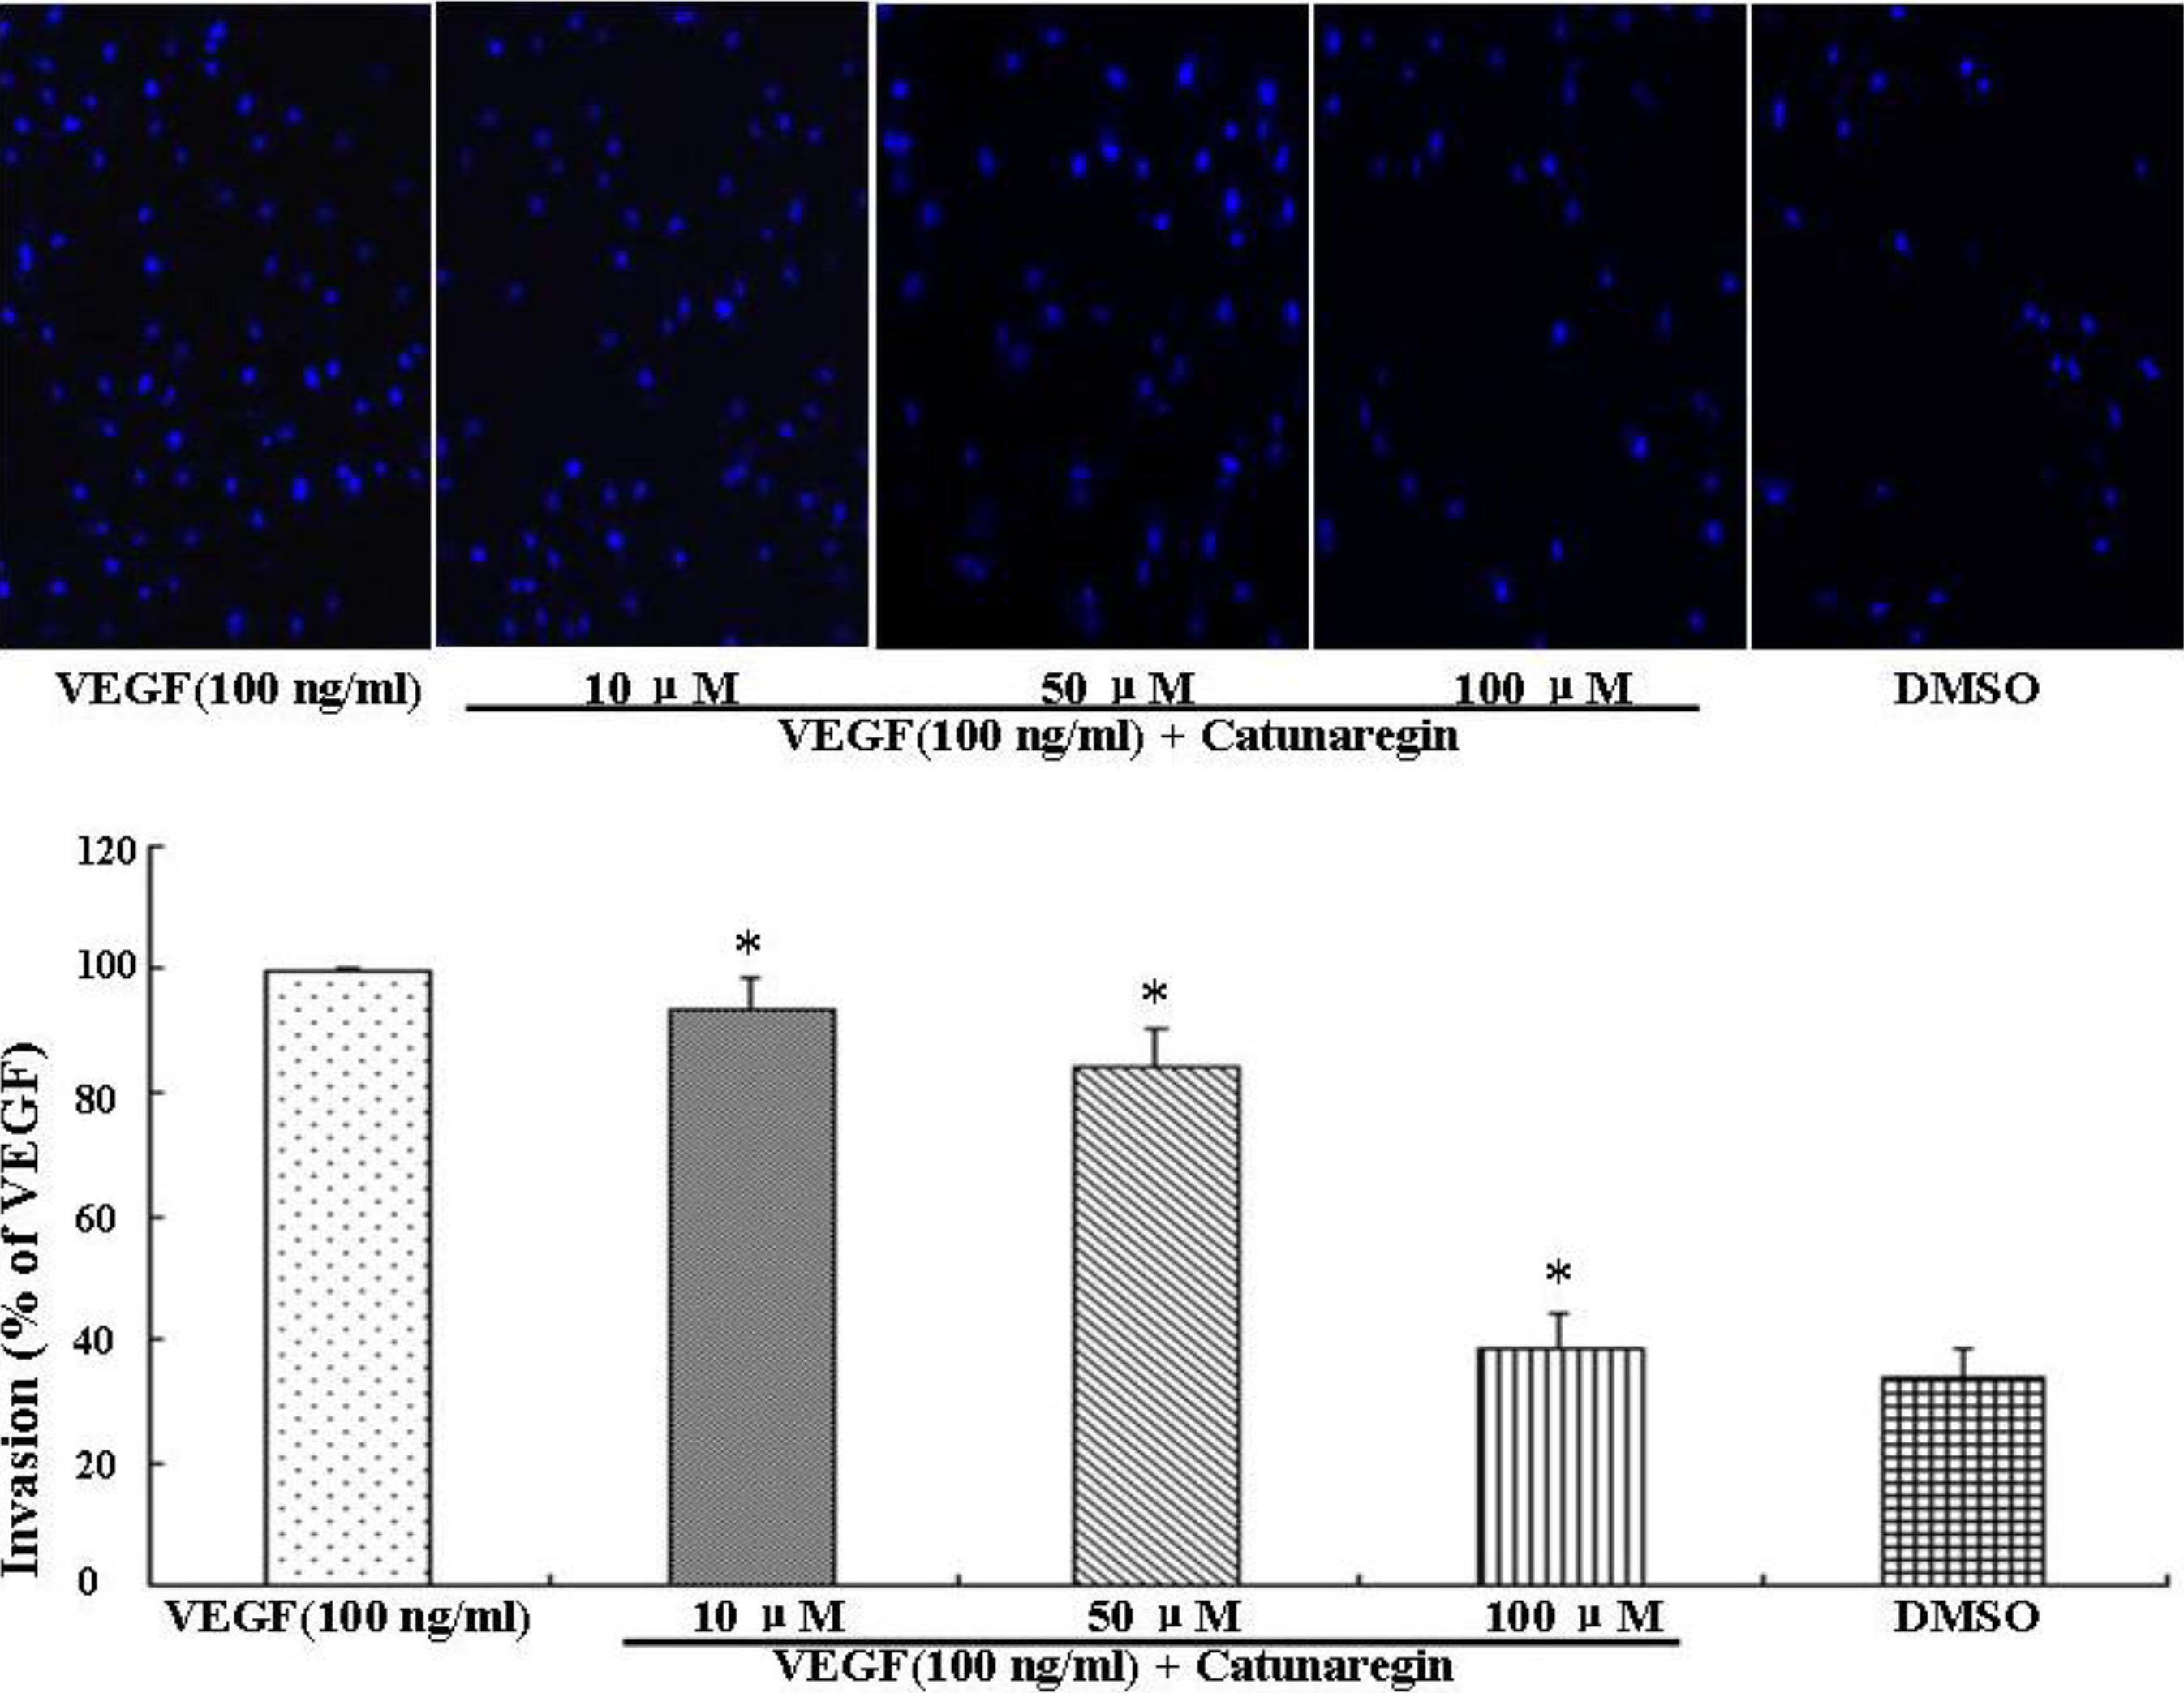
Fig. 2
Anti-angiogenic effect of catunaregin in invasion of HUVECs. Representative fluorescence microscopy images. The bar chart shows quantitative data for HUVECs invasion with different treatments (* VEGF vs. catunaregin plus VEGF, p < 0.01).
Acknowledgments
This image is the copyrighted work of the attributed author or publisher, and
ZFIN has permission only to display this image to its users.
Additional permissions should be obtained from the applicable author or publisher of the image.
Full text @ Mar. Drugs