
Fig. 6
- ID
- ZDB-IMAGE-140902-35
- Publication
- Xue et al., 2014 - Organizer-derived Bmp2 is required for the formation of a correct Bmp activity gradient during embryonic development
- All Figures
- Figures for Xue et al., 2014
|
Fig. 6
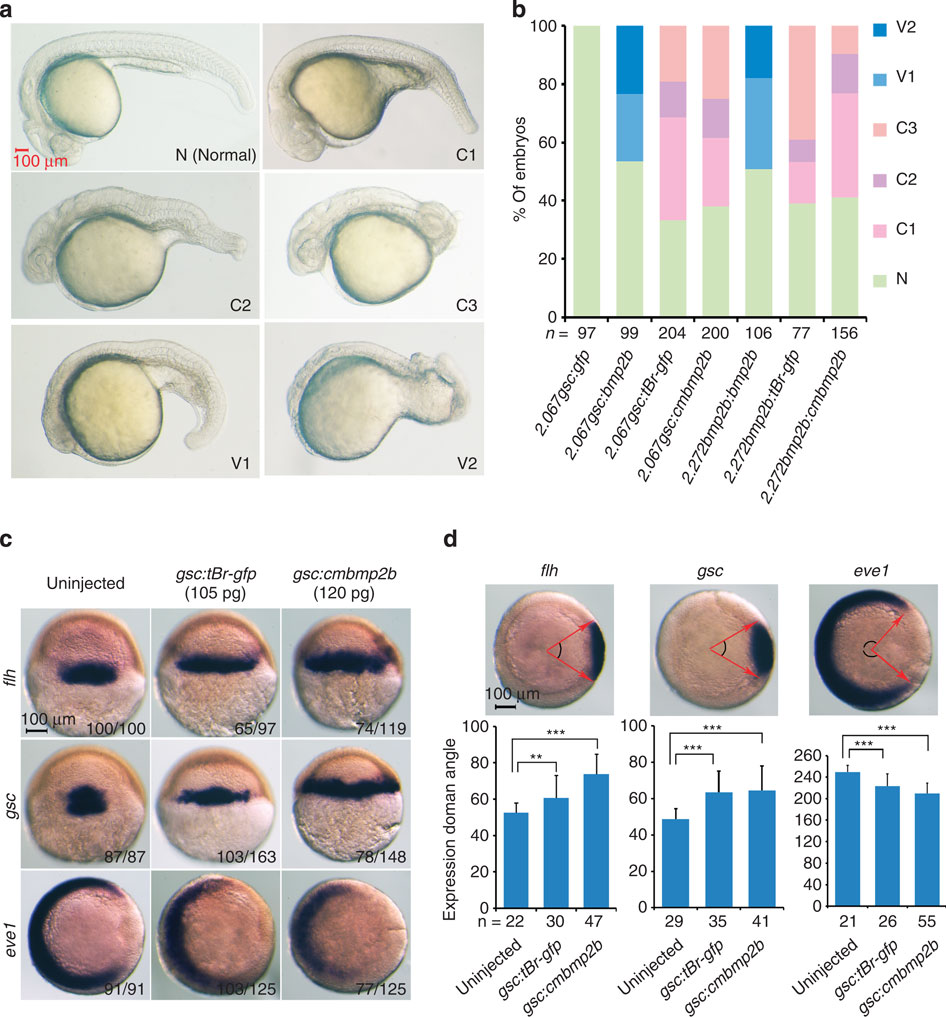
(a) Representative morphology of different categories of live embryos at 24 h.p.f. after injection. Plasmid DNA was injected at doses: 105 pg for Tg(-2.067gsc:gfp), Tg(-2.067gsc:tBr-gfp) and Tg(-2.272bmp2b:tBr-gfp); 120 pg for the other constructs. (b) The ratio of embryos in different categories following injection of different plasmids. n, the number of observed embryos. (c) Marker expression detected by in situ hybridization at the shield stage. Embryos for flh and gsc were dorsally viewed and those for eve1 were viewed from the animal-pole with dorsal to the right. The ratio of embryos with the representative expression pattern was indicated. Amplified transgene DNA fragments from corresponding constructs were used for injection. (d) Quantification of marker expression domains. The angle for each marker, as depicted in the top of each bar graph, was measured and averaged with s.d. indicated (bottom). n, the number of observed embryos. Statistical significance (Student’s t-test): **P<0.01; ***P<0.0001.