
Fig. 5
- ID
- ZDB-IMAGE-140902-34
- Publication
- Xue et al., 2014 - Organizer-derived Bmp2 is required for the formation of a correct Bmp activity gradient during embryonic development
- All Figures
- Figures for Xue et al., 2014
|
Fig. 5
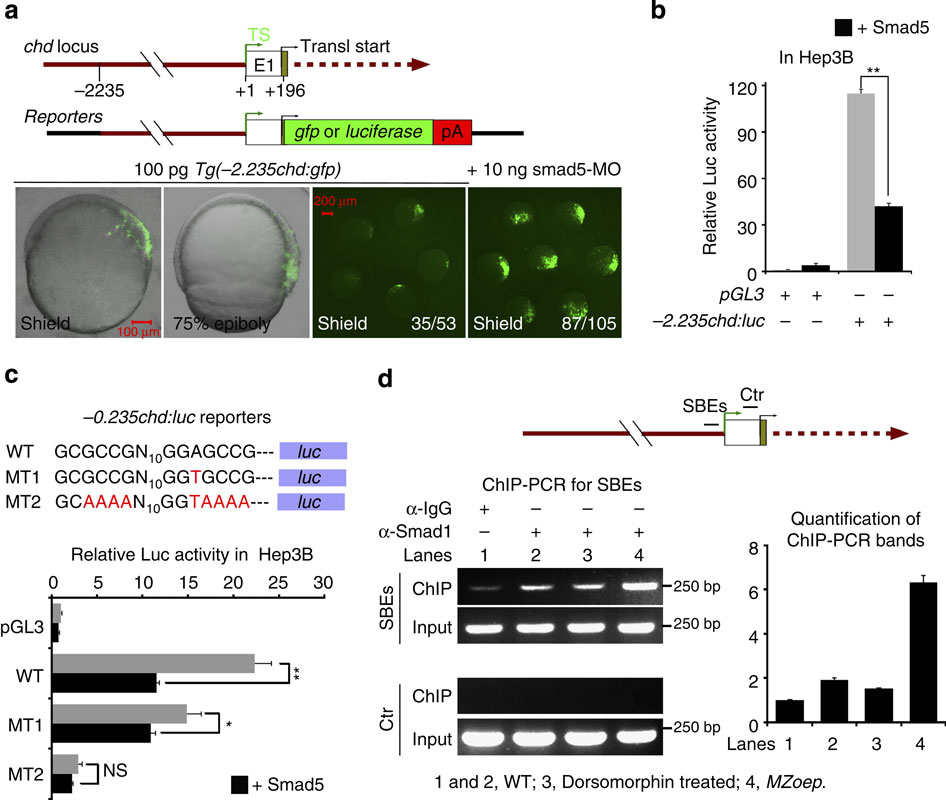
(a) GFP expression driven by a chd promoter. Top panel illustrated structures of the chd locus and reporter constructs. TS, transcription start. Bottom panel showed gfp reporter expression in embryos at different stages with the ratio of indicated GFP-positive embryos. (b) Luciferase reporter expression driven by the chd promoter in Hep3B. The pGL3(-2.235chd:luc) construct was transfected alone or together with human Smad5, and relative luciferase activity was the mean from three experiments with s.d. indicated. Statistical significance (Student’s t-test): **P<0.01. (c) Effect of mutations in defined cis-elements on luciferase reporter expression. The top panel illustrated different constructs and the bottom panel showed luciferase reporter expression in Hep3B cells after transfection with reporter construct alone or together with Smad5. The average with s.d. was calculated from three independent experimental results. Statistical significance (Student’s t-test): *P<0.05; **P<0.01; NS, P>0.05. (d) Detection of Smad1 bound to chd promoter by using ChIP assay. On the top, illustration of the amplified Smad1-occupied region (SBEs) and a control region (Ctr) in chd locus; left panel in the bottom, ChIP-PCR results; bar graph in the bottom, quantification of the amplified SBEs fragment. The shown were the mean with s.d. from three experiments.