
Fig. S2
- ID
- ZDB-IMAGE-140806-2
- Publication
- Coxam et al., 2014 - Pkd1 Regulates Lymphatic Vascular Morphogenesis during Development
- All Figures
- Figures for Coxam et al., 2014
|
Fig. S2
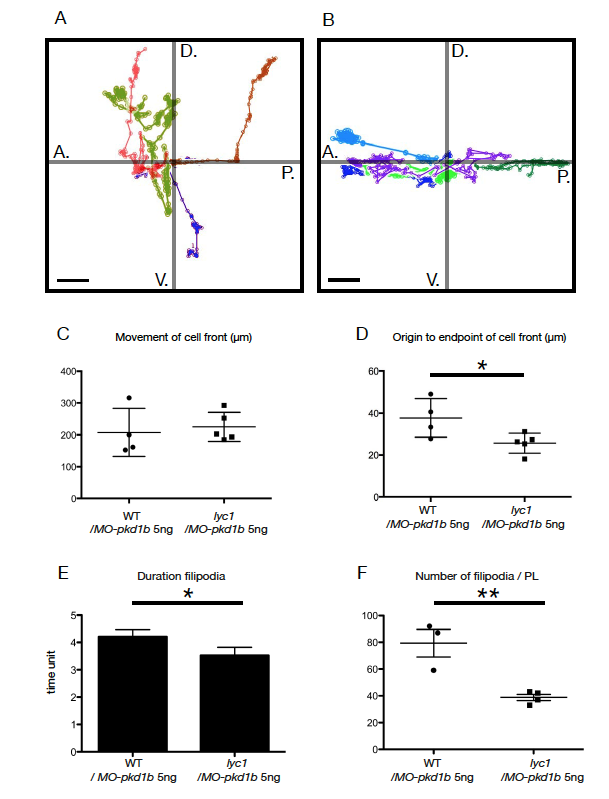
Parachordal lymphangioblasts fail to directionally migrate and display altered cell dynamics in the lyc1 mutant. Related to Figure 1.
(A-B) Schematic overview of the movement of the leading front of individual parachordal lymphangioblasts (t=10.5h) from 56 hpf (scale bar: 10 μm) in (A) WT/MO-pkd1b (5ng MO) (n=3 embryos, n=4 leading fronts) and (B) phenotypically mutant lyc1/ MO-pkd1b (5ng MO) (n=5 embryos, n=5 leading fronts).
(C-D) Quantification of (C) movement of cell front and (D) origin to endpoint of cell front distance migrated by parachordal lymphangioblasts (t=10.5h) from 56 hpf in in WT/MO-pkd1b (5ng MO) (n=3 embryos, n=4 leading front) and phenotypically mutant lyc1/ MO-pkd1b (5ng MO) (n=5 embryos, n=5 leading fronts) (μm).
(E) Quantification of duration of individual filipodial extensions in single parachordal lymphangioblasts at the horizontal myoseptum by time-lapse imaging (spinning disc). WT/MO-pkd1b (n=3) and phenotypically mutant lyc1/MO-pkd1b embryos (n=4) (5ng MO) were examined between 56-64 hpf (1 time unit = 4 minutes).
(F) Quantification of the number of filipodial extensions per parachordal lymphangioblasts by time-lapse imaging (spinning disc) in WT/MO-pkd1b (n=3) and phenotypically mutant lyc1/MO-pkd1b embryos (n=4) (5ng MO) between 56-64 hpf.