
|
Fig. S1
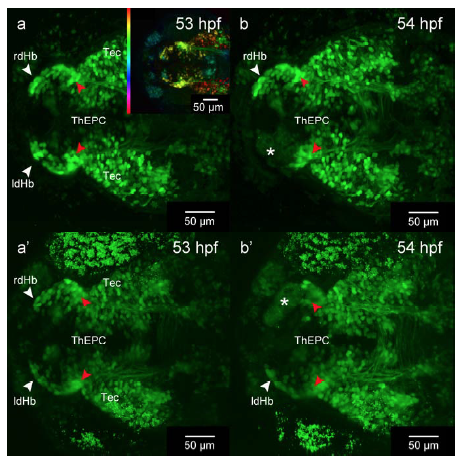
Ablation of dHb cells at 53 hpf, related to Figure 2.
(a-b′) Dorsal view, anterior to the left, MIP of Et(-1.0otpa:mmGFP)hd1 transgenic embryos before and after complete dHb cell ablation. (a-a′) White arrowheads mark the bilateral dHb nuclei before dHb ablation. Red arrowheads highlight the position of ThEPC neurons. Inset shows a spectrum LUT with a z-depth of 350 μm to highlight that dHb and ThEPC cells can be distinguished because of their different positioning along the D-V and A-P axis. Gamma was adjusted to 0.65. (b-b′) Asterisks mark the site of ablation, white arrowheads mark non-ablated dHb cells and the red arrowheads mark the ThEPC neurons. GFP expression was monitored between 2 and 4 days.