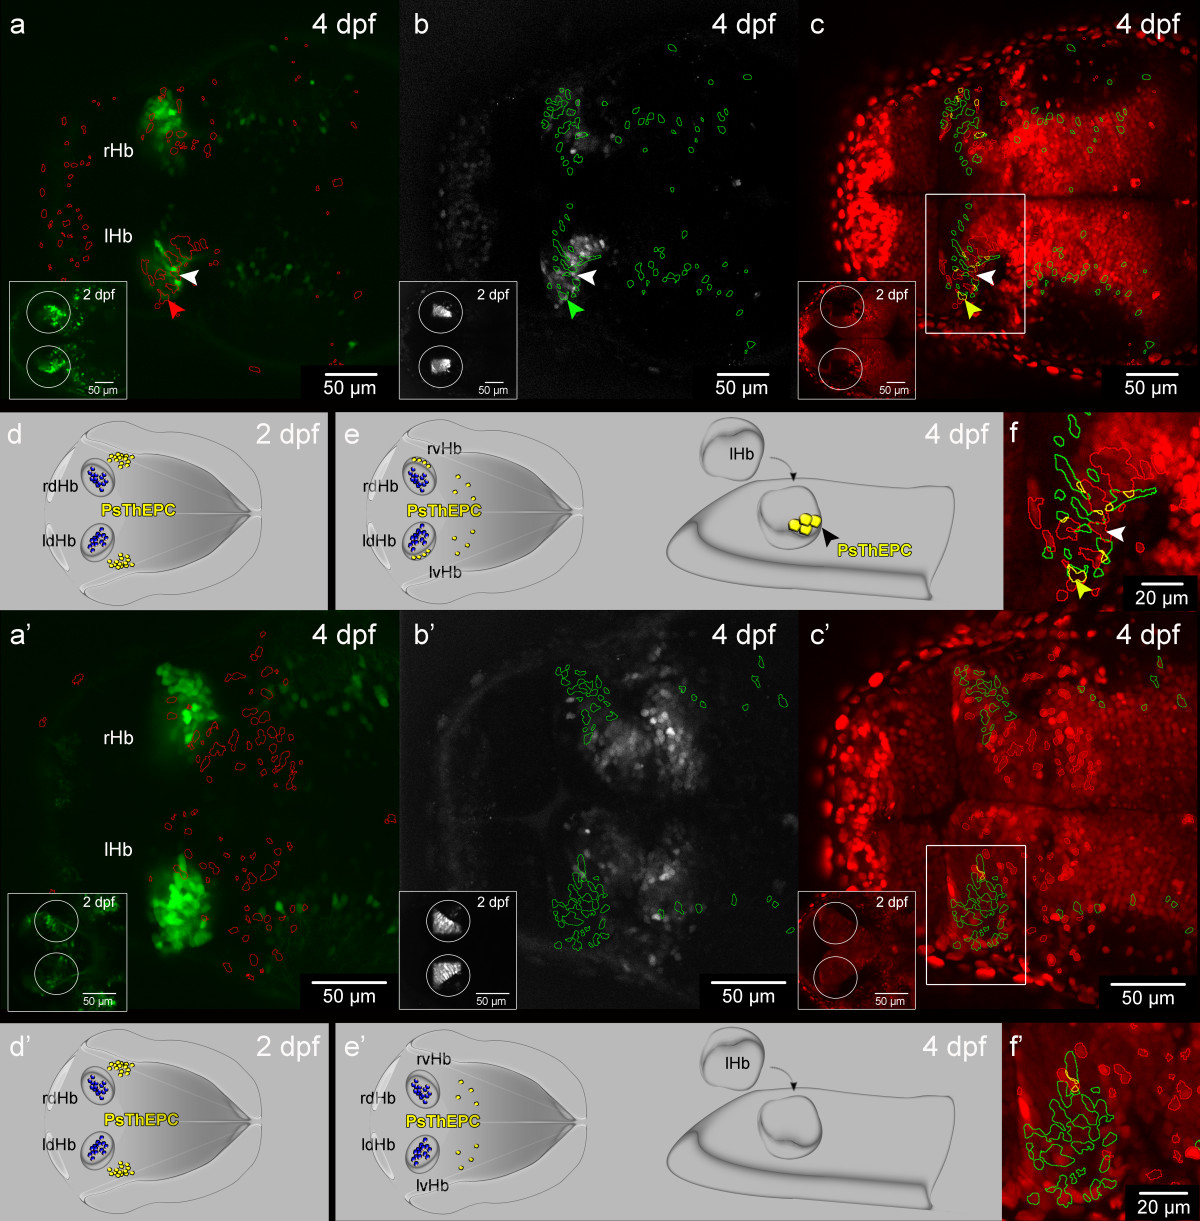
Fig. 3
A population of thalamic cells forms the ventral habenula (vHb) in the presence of Tcf7l2 function. (a-c′) Dorsal views, anterior to the left, of a slice from a stack showing 4 dpf (a-c)Et(1.0otpa:mmGFP)hd1 and (a′-c′)tcf7l2exl/exl x Et(1.0otpa:mmGFP)hd1 embryos after photoconversion of H2B-PSmOrange positive cells in the thalamus at 2 dpf (insets). Circles highlight the area of photoconversion. All targeted cells express the photoconverted protein and are in the centre of the circles. The gamma was adjusted to a value between 0.60 and 0.90. (a-a′) Red ROIs show the position of the photoconverted cells in the green channel. (b-b′) Green ROIs show the location of GFP positive cells in the far-red channel. (c-c′) Red and green ROIs were combined in the red channel to visualize the position of GFP photoconverted ThEPC neurons in the habenular nuclei in yellow. Box indicates the region shown in f and f′ with higher magnification for clarity. (a-c,f) Colored arrowheads mark a photoconverted ThEPC derived GFP positive cell in the habenula. White arrowheads mark a photoconverted GFP negative cell in the habenula. (a′-c′,f′) Photoconverted cells are not found in the habenulae of tcf7l2exl/exl mutants. (d-e′) Model showing the contribution of some ThEPC cells (yellow) to the vHb in wild type embryos but not in tcf7l2exl/exl mutants. dHb cells are marked in blue. lHb, left habenula; lvHb, left ventral habenula; Ps, photoconverted; rHb, right habenula; rvHb, right ventral habenula; ROI, region of interest; ThEPC, thalamic-epithalamic early projecting cluster.

