
|
Fig. 1
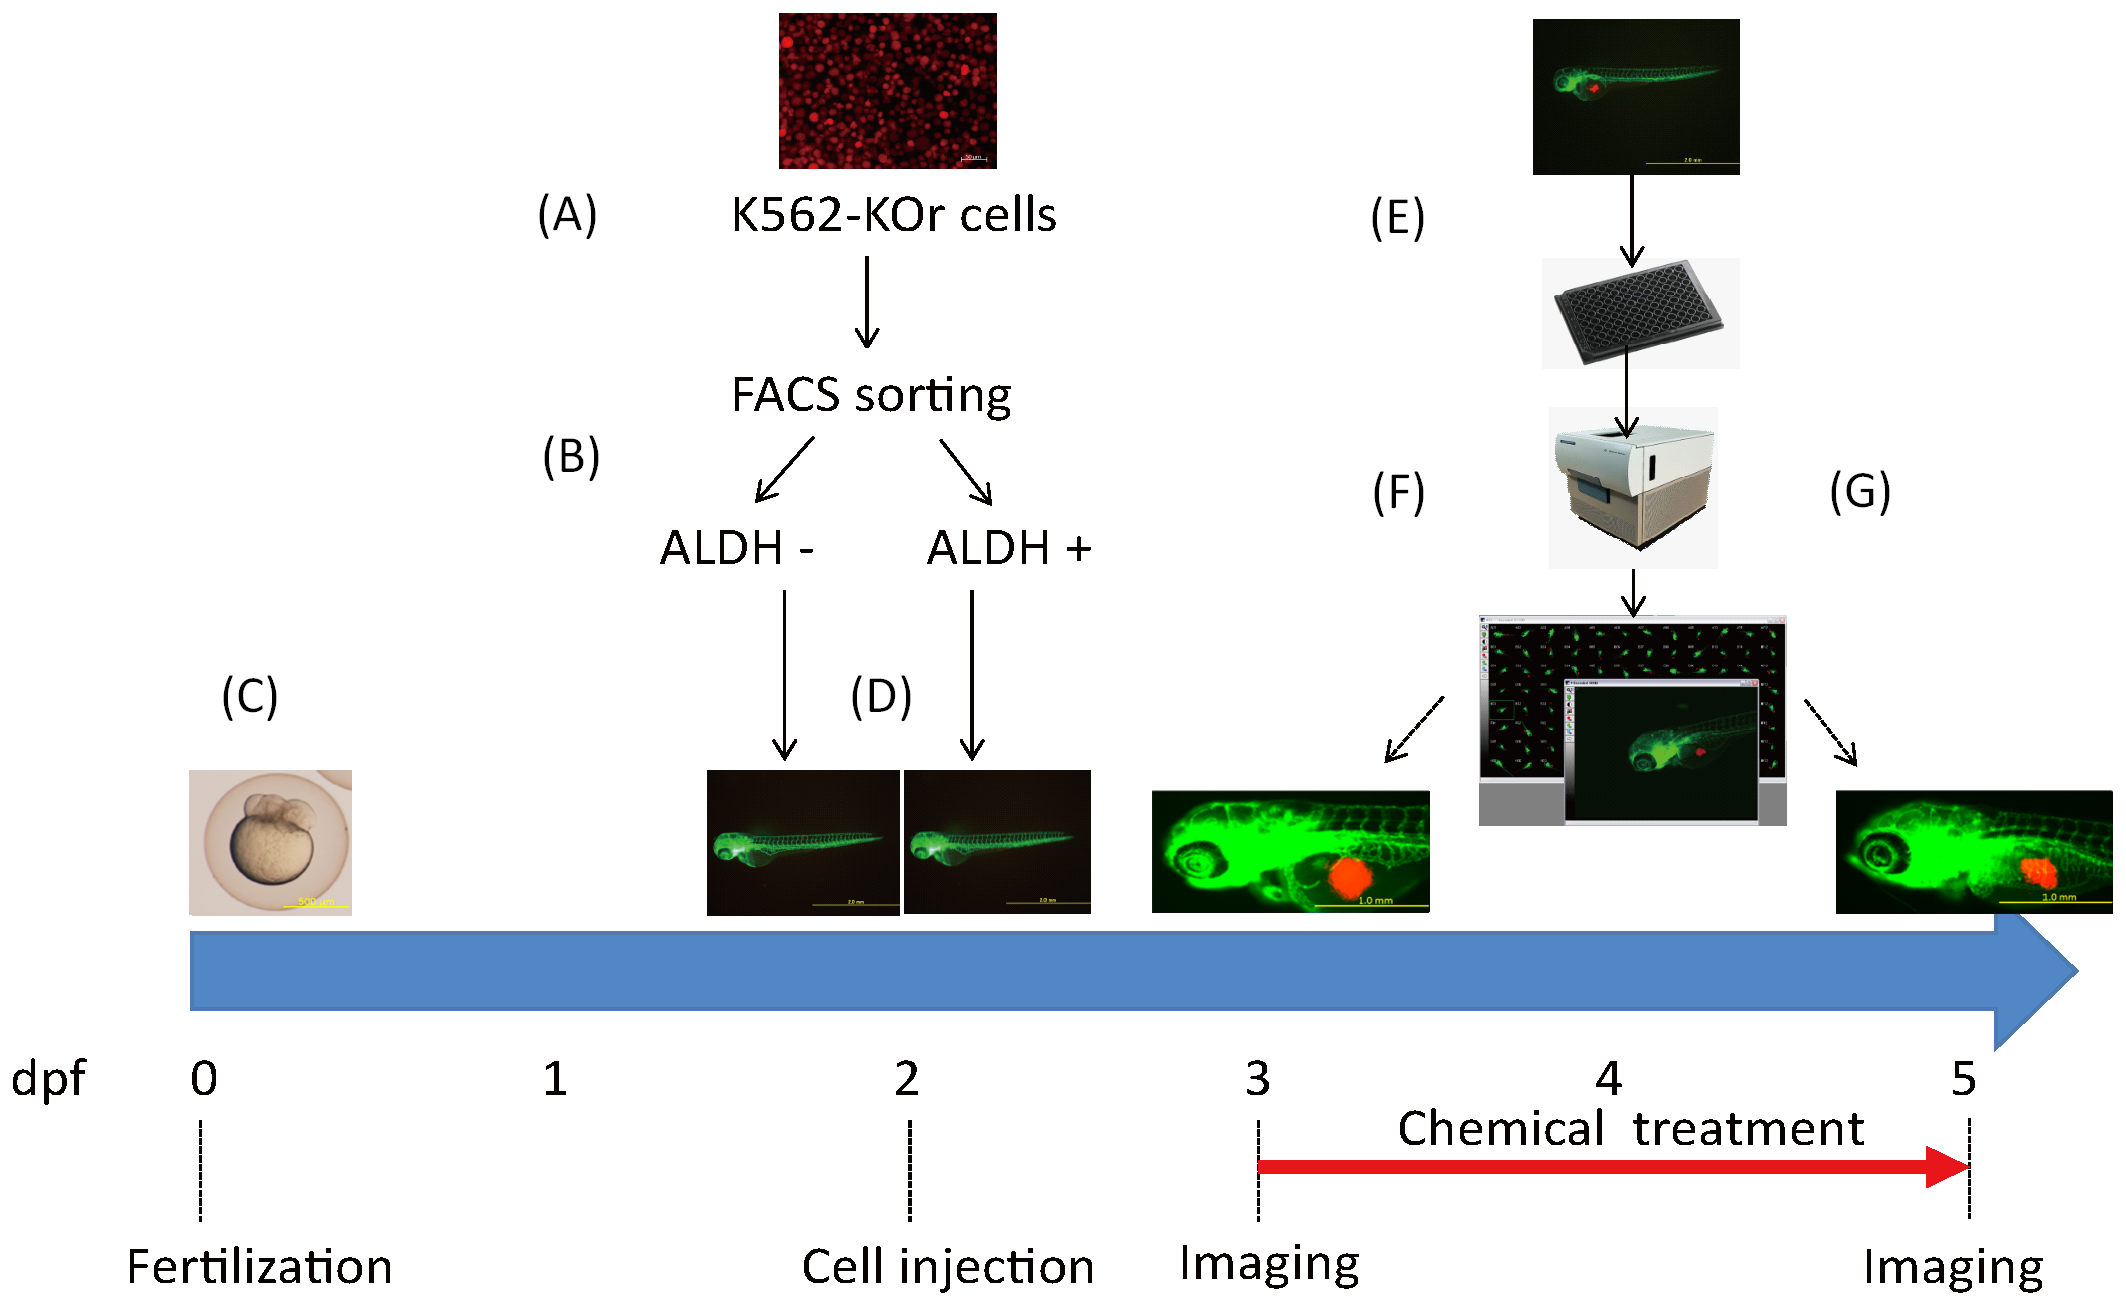
Schematic representation of the experimental design for LSC inhibitor screening in zebrafish.
(A) Cultured K562 cells expressing a Kusabira-orange (KOr) fluorescent protein. Scale bar: 50 μm. (B) Sorting of ALDH- and ALDH+ cell populations. (C) A preparation of zebrafish embryos. Scale bar: 500 μm. (D) Xenotransplantation of ALDH- and ALDH+ cells into zebrafish at 48 hpf. Scale bar: 1.0 mm. (E, F) Xenografted zebrafish were transferred into 96-well plates at 72 hpf, imaged using a high-content imaging system, and then treated with the test compounds. Scale bar: 1.0 mm. (G) At 120 h (48 h after treatment), the xenografted zebrafish were imaged again to evaluate the effects of the chemicals. Scale bar: 1.0 mm.