
IMAGE
Fig. 6
- ID
- ZDB-IMAGE-140730-37
- Publication
- Govindan et al., 2014 - Hapln1a is required for connexin43-dependent growth and patterning in the regenerating fin skeleton
- All Figures
- Figures for Govindan et al., 2014
Image
|
Figure Caption
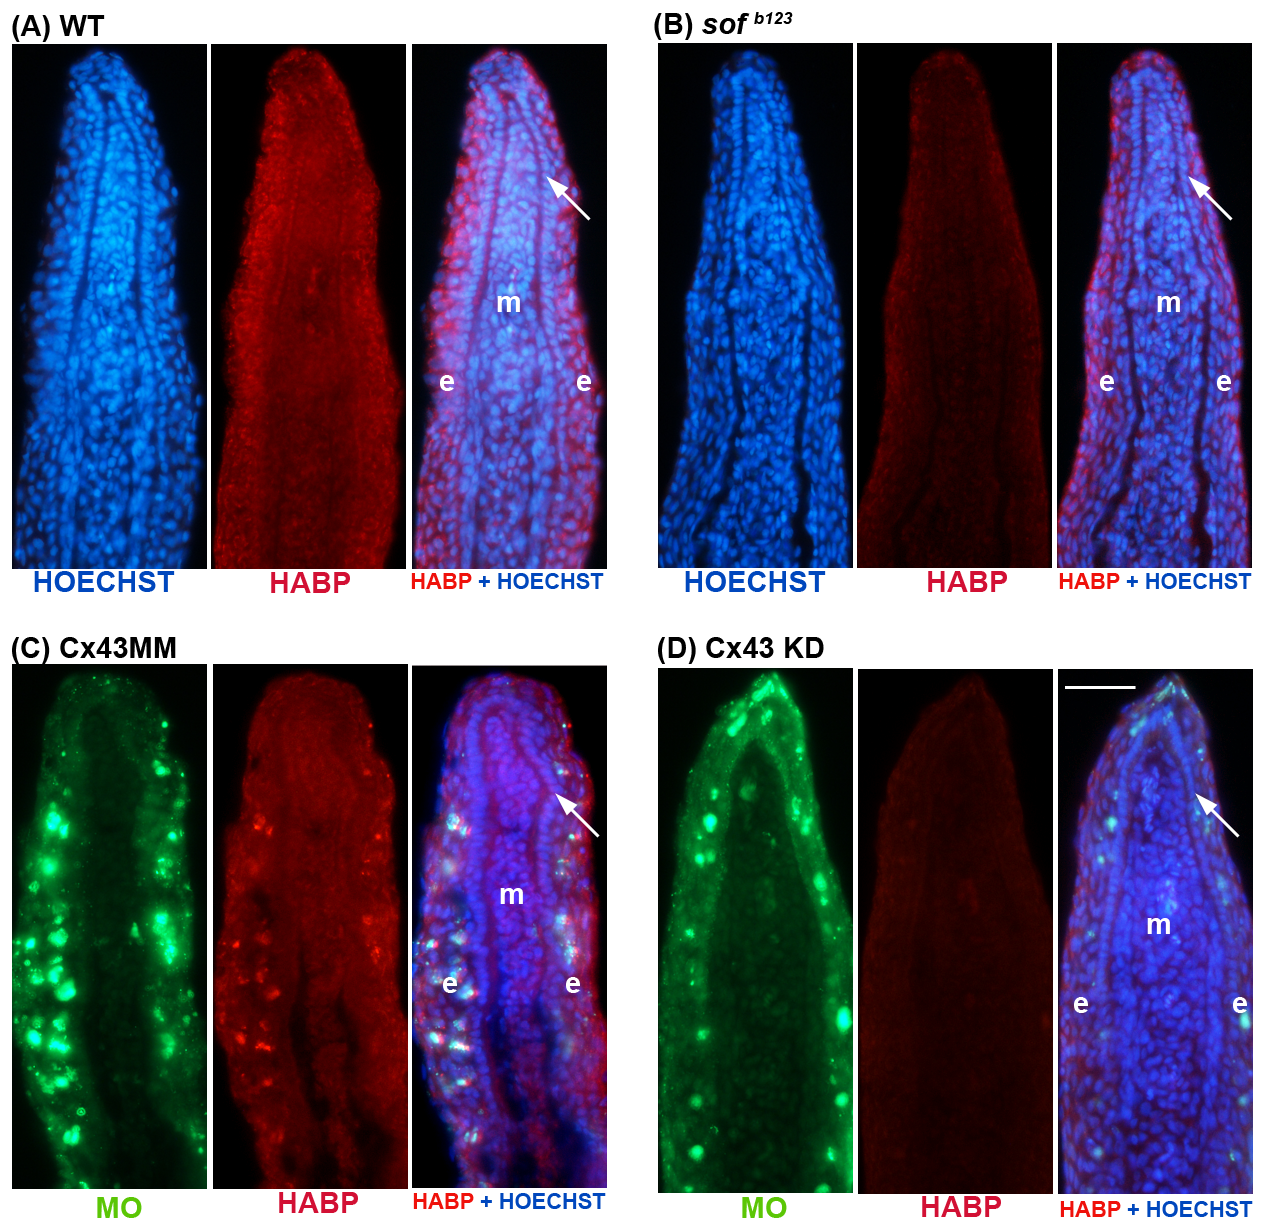
Fig. 6
HA levels are reduced in sof b123 and in cx43-KD regenerating fins.
Immunostaining for HA (Red) and HOECHST staining for DNA (blue). In the panels treated for cx43-MO or MM, the green reveals the location of the MOs, which are fluroescein tagged. HA levels were detected as described in Figure 4. (A,C) HA levels in WT 5 dpa regenerating fins and in WT fins treated for cx43-MM. (B,D) HA levels are reduced in sof b123 regenerating fins and in WT fins treated for cx43-MO. Arrow identifies the basal layer of the epidermis; m, mesenchyme; e, epithelium. Scale bar is 50 μm.
Acknowledgments
This image is the copyrighted work of the attributed author or publisher, and
ZFIN has permission only to display this image to its users.
Additional permissions should be obtained from the applicable author or publisher of the image.
Full text @ PLoS One