
Fig. 2
- ID
- ZDB-IMAGE-140730-114
- Publication
- Samson et al., 2013 - 3-OST-7 regulates BMP-dependent cardiac contraction
- All Figures
- Figures for Samson et al., 2013
|
Fig. 2
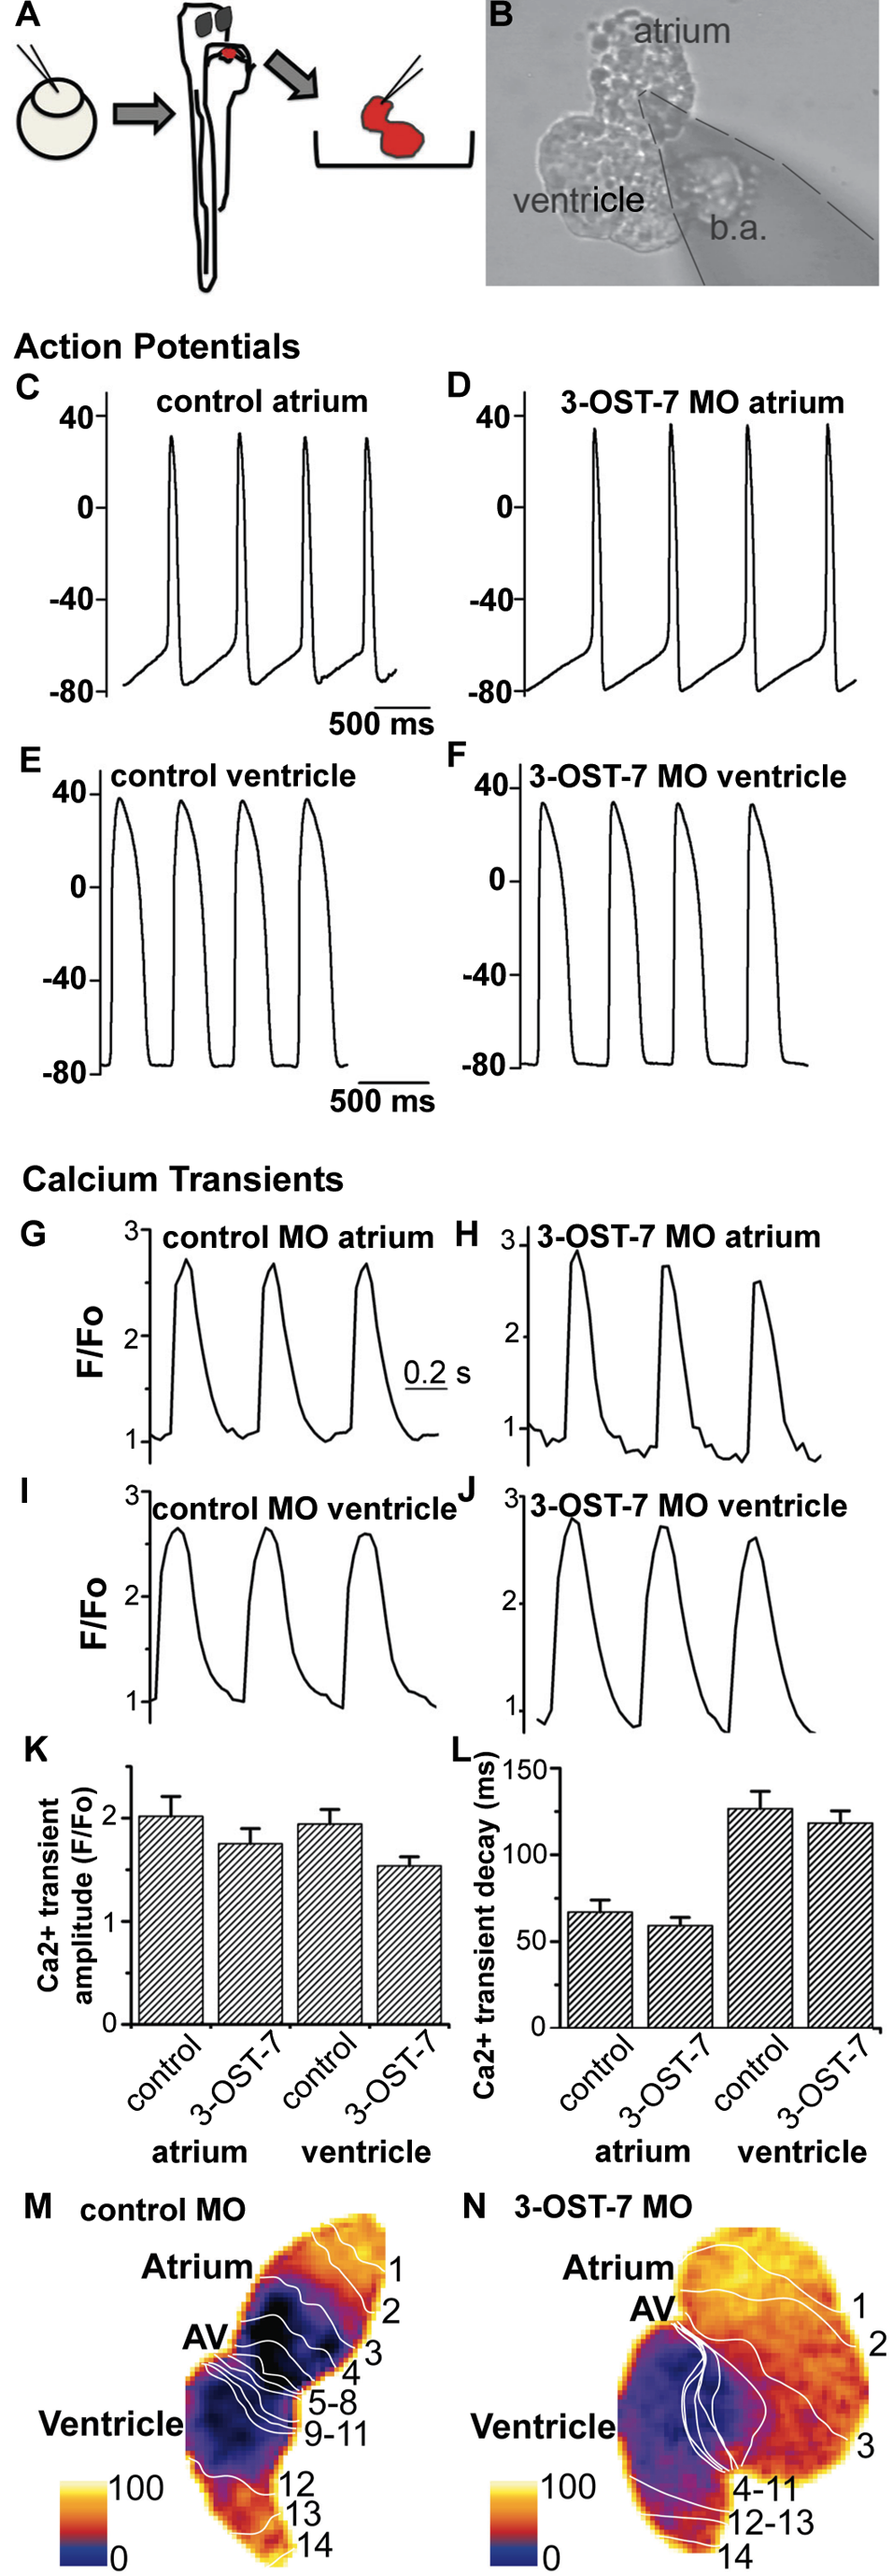
Noncontracting ventricle in 3-OST-7 morphants generates normal action potentials and calcium transients.
(A) Zebrafish embryos were injected with 3-OST-7 MO1 at one-cell stage and allowed to develop until 48 hpf. The heart was then dissected out of the embryo and either placed in a recording chamber perfused with external control solution (for action potential analysis) or incubated in Fluo-4 and imaged using a confocal microscope (for calcium transient analysis). Control 48 hpf hearts from uninjected embryos or injected with control 3-OST-5 MO were processed in parallel. (B) A suction pipette was used to patch clamp the heart at the atrial or ventricular region. Action potentials were recorded from atria (C–D) and ventricles (E–F) of control (uninjected, WT) (C and E) and 3-OST-7 morphant (D and F) embryos. The action potentials were comparable between control and 3-OST-7 morphant embryos. Regions were selected from atrium and ventricle to record the calcium transients (G–J) and measure the Ca2+ transient amplitude (K) and Ca2+ transient decay (L) (error bars, SEM). No significant difference was detected between control and 3-OST-7 morphant embryos (p = 0.30 for atrial transient amplitude; p = 0.16 for ventricular transient amplitude; p = 0.37 for atrial transient decay; and p = 0.51 for ventricular transient decay). In the second technique to image the calcium transients, 3-OST-7 MO1 or control 3-OST-3Z MO was injected into Tg(cmlc2:gCaMP)s878 embryos at one-cell stage and allowed to develop until 48 hpf. Optical maps of calcium activation for a single cycle, represented by isochronal lines every 20 ms, show calcium activation and conduction velocity proceed normally in 3-OST-7 morphants (N) compared to control MO injected embryos (M). Conduction proceeds from the atrium through the AV canal to the ventricle and numbers indicate the temporal sequence of calcium activation. Color bar chart fluorescence intensity changes on a scale of 0 to 100. b.a., bulbus arteriosus.