
Fig. 1
- ID
- ZDB-IMAGE-140728-2
- Genes
- Publication
- Jiang et al., 2014 - Gene-expression analysis of hair cell regeneration in the zebrafish lateral line
- All Figures
- Figures for Jiang et al., 2014
|
Fig. 1
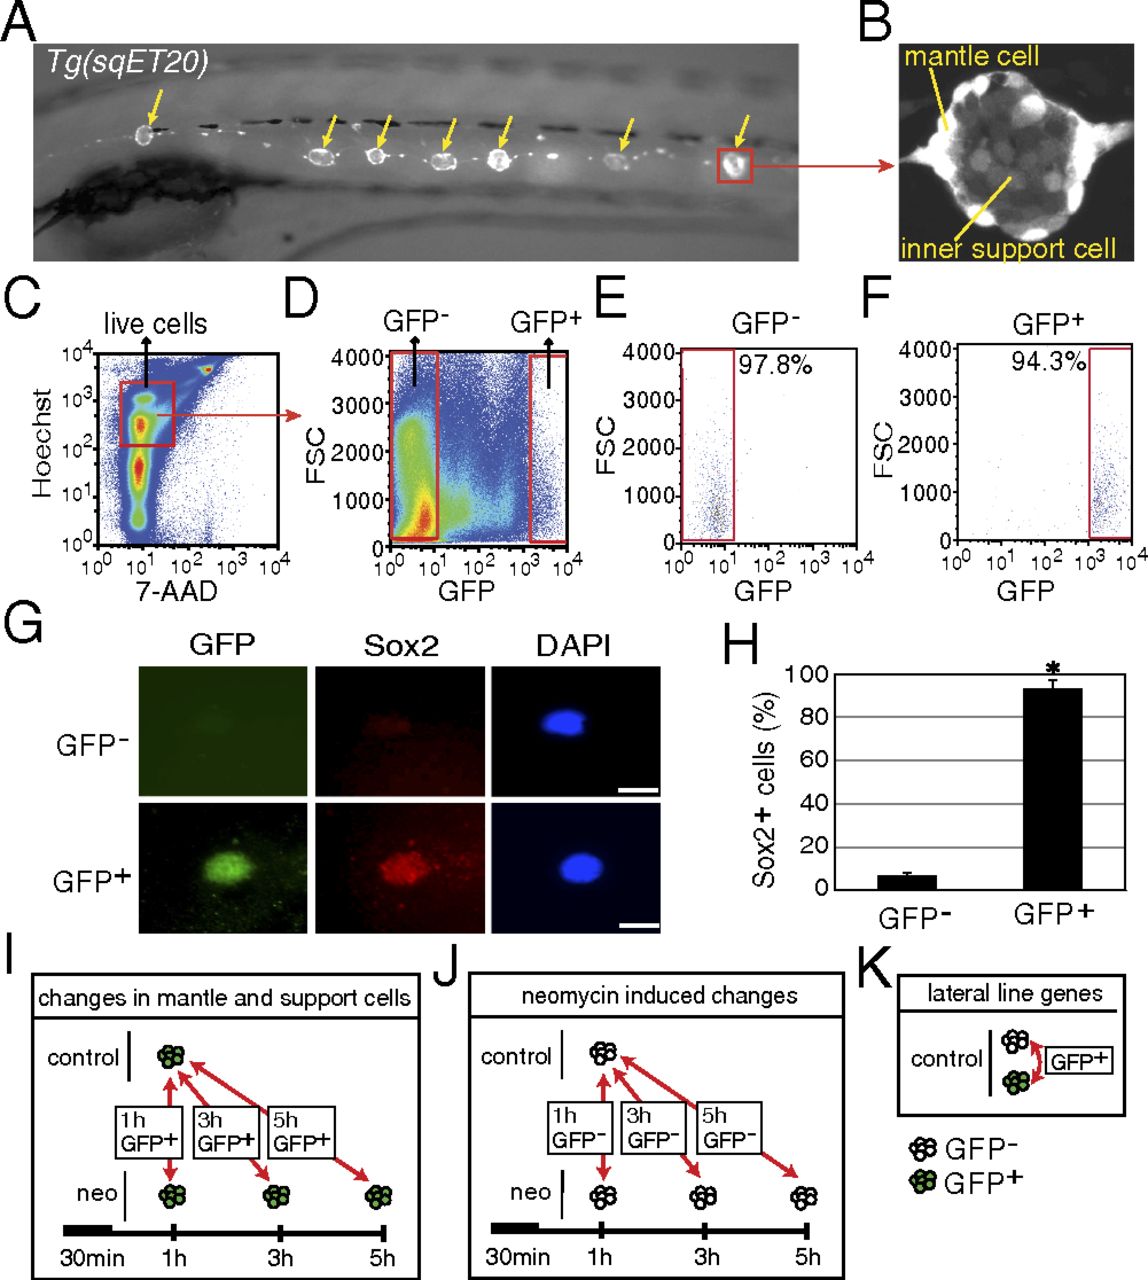
Purification of mantle and inner support cells from Tg(sqET20). (A) In 5-dpf Tg(sqET20) larvae GFP is expressed in neuromasts (arrows) and in the interneuromast cells that connect adjacent neuromasts. (B) Magnification of a neuromast shows that mantle cells are strongly labeled by GFP, but inner support cells are weakly labeled. (C and D) Dissociated cells of Tg(sqET20) larvae at 5 dpf were FACS sorted using a two-gate sorting strategy. Live cells were gated by 7-AAD and Hoechst+ (C) and subsequently were gated by forward scatter (FSC) and GFP intensity to isolate GFP and GFP+ cells (D). (E and F) A postsorting experiment shows that GFP cells are 97.8% pure (E) and GFP+ cells are 94.3% pure (F). (G) Sorted GFP and GFP+ cells were stained with Sox2 antibody and DAPI. (Upper) A GFP cell is Sox2. (Lower) A GFP+ cell expresses Sox2. (Scale bars: 5 μm.) (H) Quantification of Sox2+ cells in each population as mean ± SD; *P < 0.01 by t test. (I) Regeneration-induced mantle and inner support cell genes were identified at each time point by comparing GFP+ neomycin-treated cells with GFP+ untreated samples. (J) Neomycin-induced genes were identified by comparing GFP neomycin-treated cells at each time point with GFP untreated samples. Neomycin-induced genes subsequently were subtracted from the gene lists obtained with GFP+ cells to select for regeneration-specific changes in gene expression in inner support and mantle cells. (K) Comparisons between GFP+ and GFP cells of untreated larvae generated a list of genes enriched in lateral line cells.