
|
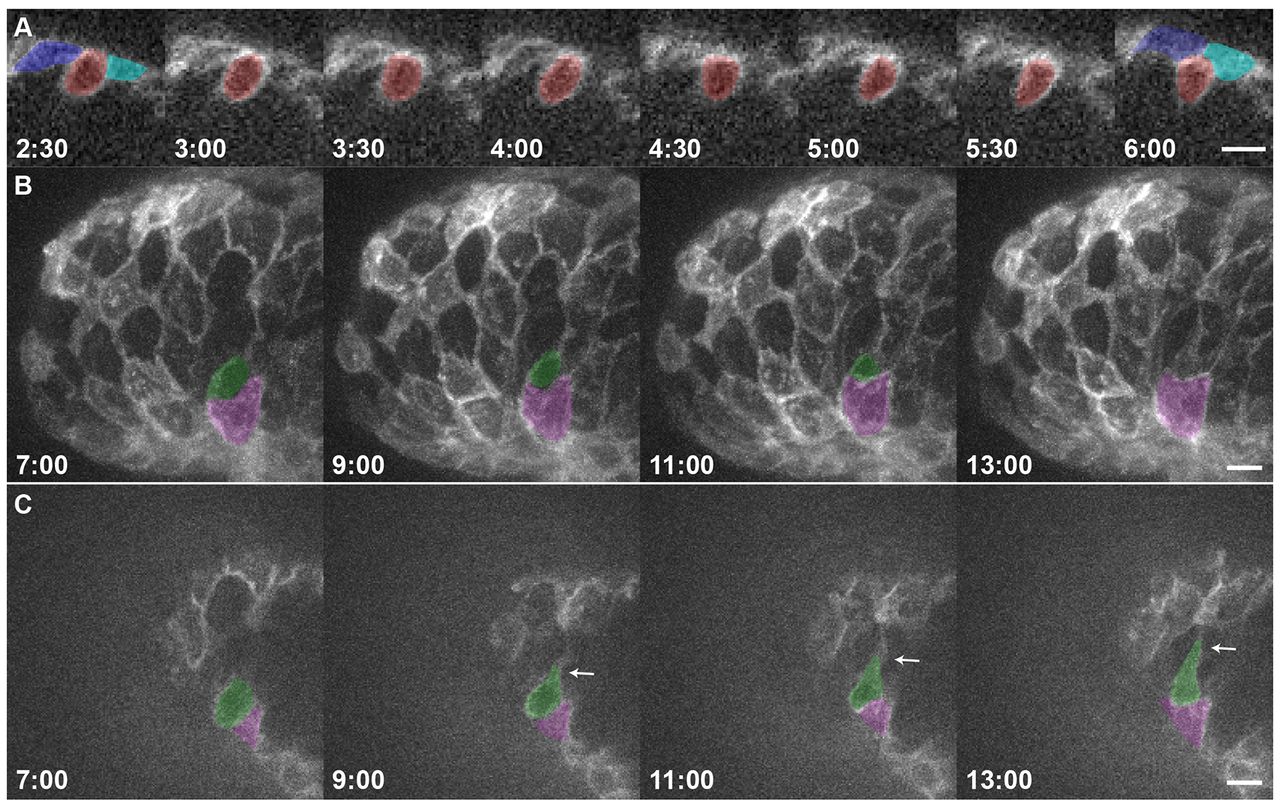
Fig. 4
Cardiomyocytes extend protrusions while constricting their abluminal surface. (A) Transverse section of a Tg(myl7:ras-GFP) heart imaged starting at 60 hpf showing a cardiomyocyte entering the trabecular layer (red). The neighboring cardiomyocytes are marked in blue and cyan at the beginning and end of the movie. Note the increase over time in Tg(myl7:ras-GFP) signal abluminal to the marked cardiomyocyte. This increase appears to be caused by the movement of neighboring cardiomyocytes. (B) 3D projection of a Tg(myl7:ras-GFP) heart imaged starting at 59 hpf. Time from start of imaging (hours:minutes) is shown on lower left. The cardiomyocyte marked in green constricts its abluminal surface. This cardiomyocyte completely exits the compact layer by 13 hours of imaging. The cardiomyocyte marked in purple changes shape to take up part of the space vacated by the green cardiomyocyte. (C) Drift-corrected (see Materials and Methods) optical slice 15 μm from the abluminal surface of the heart shown in B. Green and purple cardiomyocytes from B are marked accordingly. The green cardiomyocyte extends a protrusion luminally (arrows). Scale bars: 10 μm.