
|
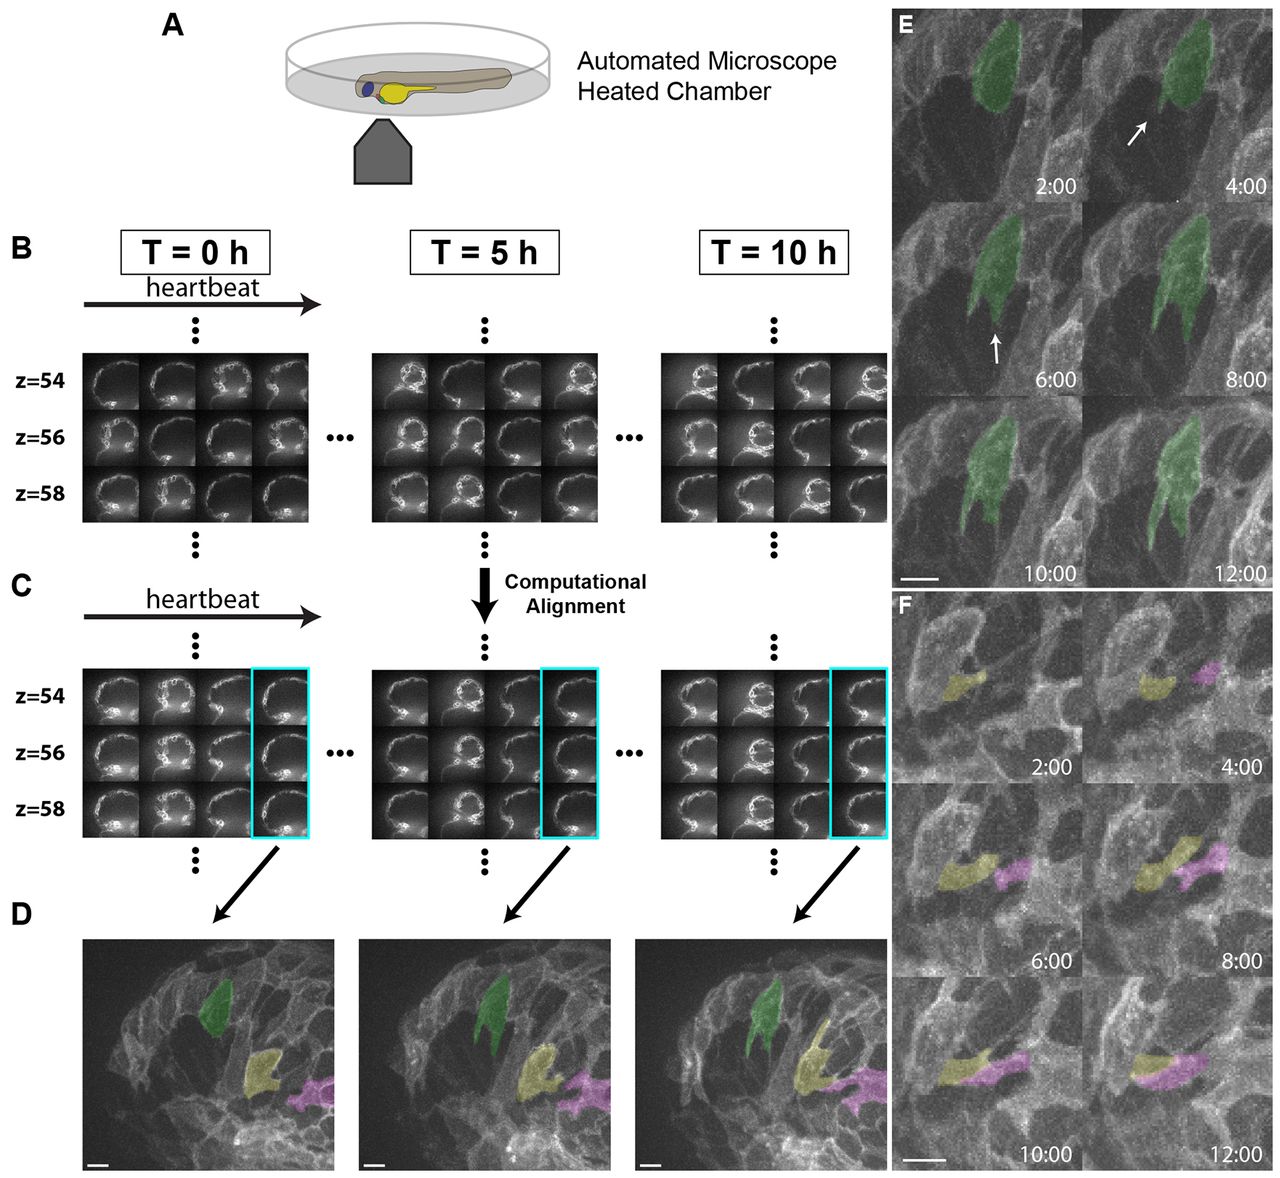
Fig. 1
Live imaging reveals the dynamics of cardiomyocyte protrusions. (A) Zebrafish embryos at 55-60 hpf were imaged in glass plates on an automated, inverted microscope equipped with a spinning disk. (B-D) Steps in the data processing pipeline. The three columns show datasets acquired from the same embryo at the indicated time points after the start of imaging. (B) Data are initially acquired as unsynchronized z-stacks of movies. Frames from three sequential z-slices are shown. Note that the rows (z-slices) are unsynchronized. (C) Frames following computational alignment: sequences from each z-slice are temporally registered (e.g. delayed or advanced) to match those in other z-slices and developmental stages. The turquoise box contains the frame during ventricular relaxation that is used for further analysis. (D) Maximum intensity z-projections of the relaxed ventricle from the three developmental time points. Individual cardiomyocytes are pseudocolored green, magenta and yellow. Note the dramatic cell shape changes that can be observed after computational alignment. (E) Time-lapse images of cellular protrusions. A cardiomyocyte extending protrusions is marked in green. Arrows point to the emerging protrusions. (F) Time-lapse images of two protrusions, highlighted in yellow and purple, extending towards each other. The two protrusions appear to form a cell-cell junction by 12 hours of imaging. Scale bars: 10 μm.