
Fig. 3
- ID
- ZDB-IMAGE-140723-50
- Genes
- Publication
- Quillien et al., 2014 - Distinct Notch signaling outputs pattern the developing arterial system
- All Figures
- Figures for Quillien et al., 2014
|
Fig. 3
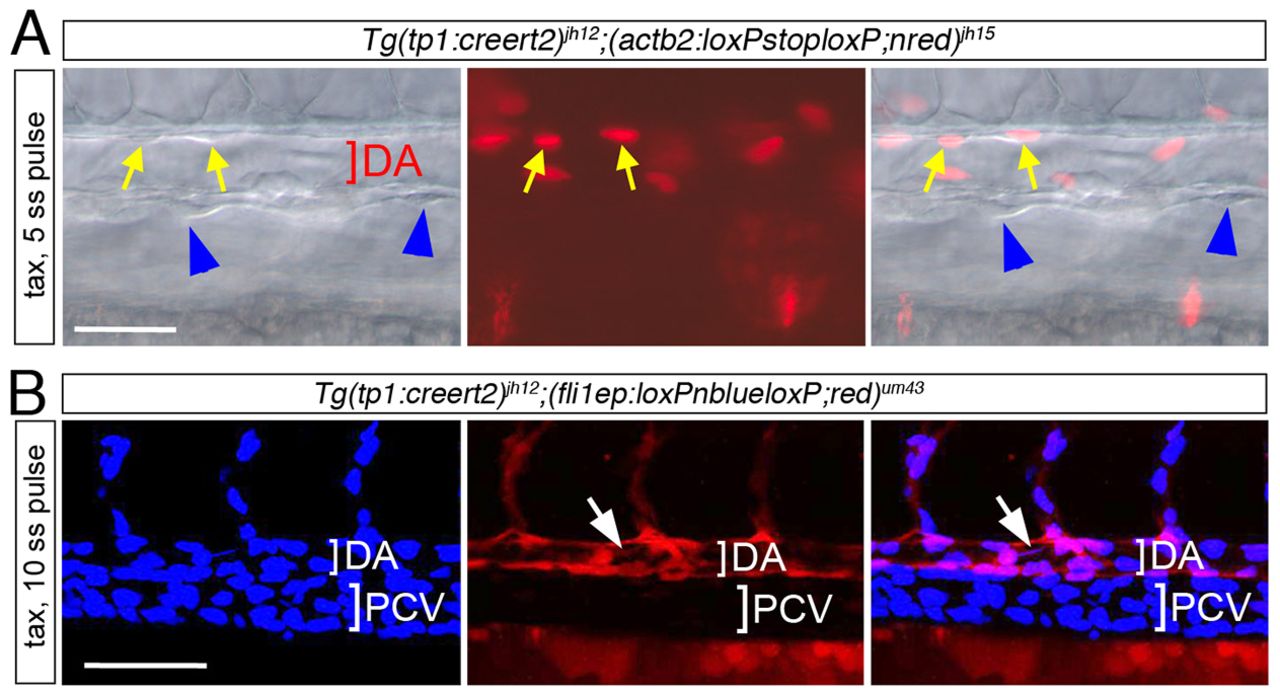
Cells exhibiting early Notch activation contribute to the dorsal aorta. Lateral views, dorsal is up, anterior to the left. (A) Tg(tp1:creert2)jh12; (actb2:loxP-stop-loxP;nred)jh15 embryo at 48 hpf following exposure to tamoxifen at 5 ss for 1 hour. Left: differential interference contrast (DIC) image; middle: epifluorescence; right: overlay image. Yellow arrows denote presumptive endothelial cells lining the dorsal aorta (red bracket); blue arrowheads label non-fluorescent venous endothelial cells. (B) Two-photon microscopy of a Tg(tp1:creert2)jh12;(fli1ep:loxP-nblue-loxP;red)um43 embryo at 30 hpf following exposure to tamoxifen at 10 ss for 1 hour. Left: blue fluorescence in all endothelial nuclei; middle: red fluorescence in lineage traced endothelial cells; right: overlay. Arrow denotes red fluorescent endothelial cells in the dorsal aorta (DA); PCV, posterior cardinal vein. Scale bars: 50 μm.