
|
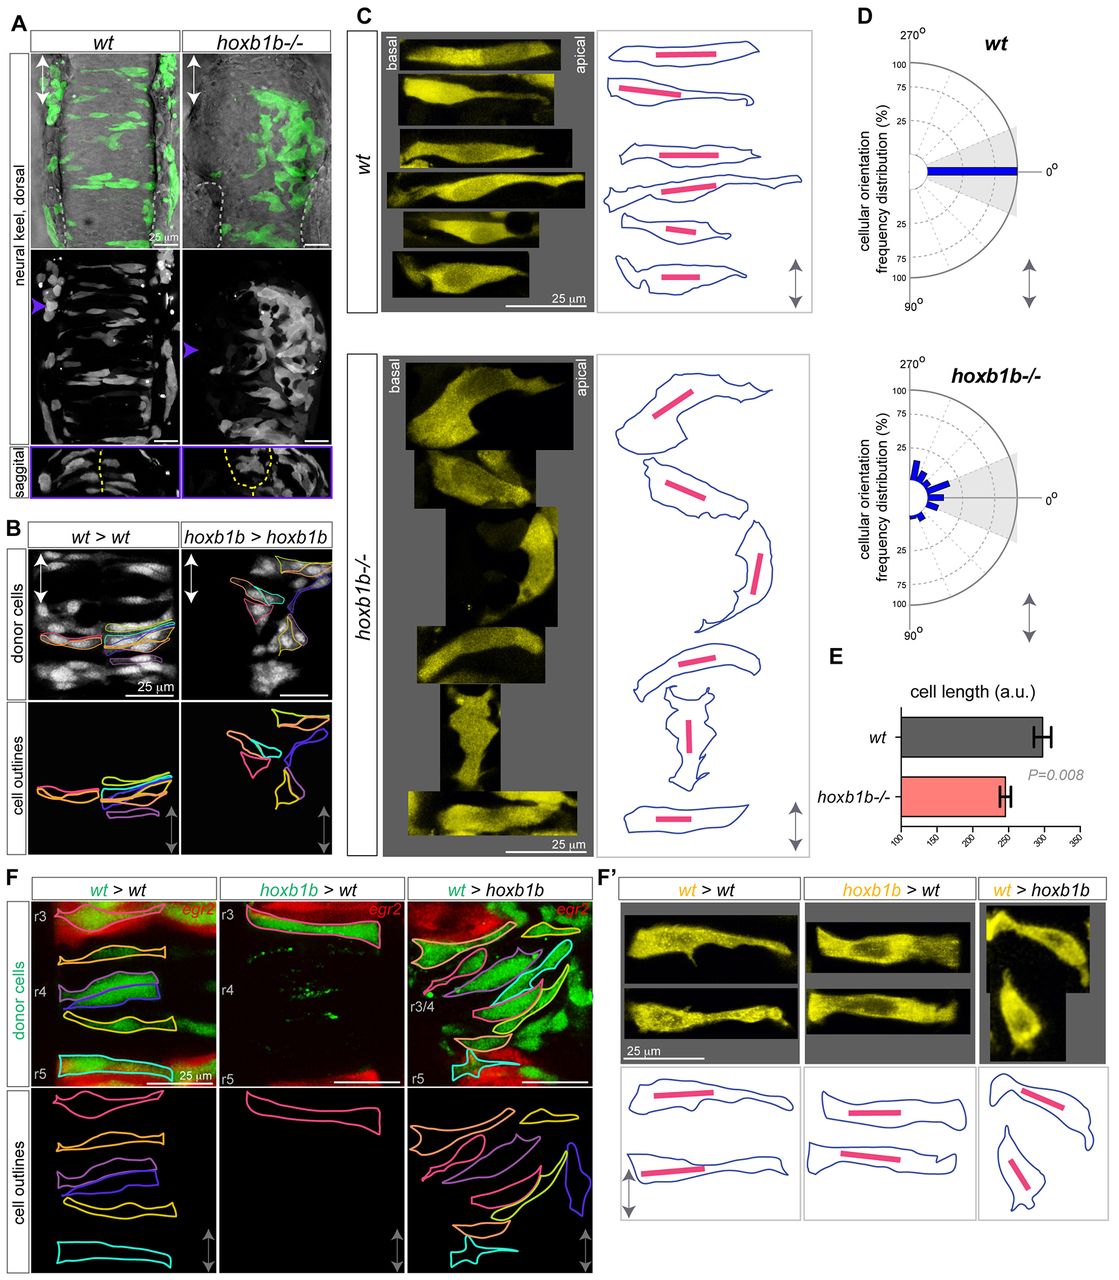
Fig. 4
Hoxb1b-dependent cell shape changes. (A) Mosaic unilateral labeling (green) of wild-type and hoxb1b-/- embryos results in a bilateral cell distribution in wild-type but unilateral, abnormal cell distribution in hoxb1b-/- embryos. Top and middle panels, dorsal view; bottom panels, sagittal optical section at the level of r3/4 at <16 hpf. White dashed lines outline otic vesicles; yellow dashed lines indicate midline. (B) Unilaterally transplanted wild-type and hoxb1b-/- donor cells in wild-type and hoxb1b-/- hosts, respectively. Single cells are outlined and are bilaterally distributed in wild type but unilateral and disorganized in hoxb1b-/- r3/4 at <17 hpf. (C) Cell shape as visualized in maximal intensity projections of single cells from r3, r4 of wild-type and hoxb1b-/- embryos at 15-17 hpf (n=3 embryos per genotype). Projections from single cells were isolated and arranged as originally embedded within the animal axis, with basal to left and more apical side to the right. Right panels: outlines of corresponding single cells (blue) from the left, with the longest diagonal of each cell presented (red line). Note elongated wild-type cells and broader, misoriented hoxb1b-/- cells. (D) Cellular orientation (based on the longest diagonal of each cell) relative to the A/P embryo axis of wild-type and hoxb1b-/- cells. The A/P axis is vertical with anterior at 0°. Note strong bias towards orientation perpendicular to the A/P in wild-type cells compared with significantly abnormal orientation of hoxb1b-/- cells. (E) Length of individual cell longest diagonal in wild-type and hoxb1b-/- r3/4 territory presented as mean ± s.e.m. Note that wild-type cells are significantly longer compared with hoxb1b-/-. (F) Cell shape of individual neuroepithelial progenitors (green) in genetic mosaics expressing egr2 transgenic reporter (red) visualizing r3 and r5 at 17 hpf. (F2) Zoomed in maximal intensity projections of single cells (yellow) from r3, r4 of transplanted cells at 15-17 hpf (n=3 embryos for all genotypes). Projections from single cells were isolated and arranged as noted for C Lower panels: outlines of corresponding single cells (blue) with the longest diagonal of each cell presented (red line). Anterior-posterior axis marked by double arrow in all panels.