
Fig. 3
- ID
- ZDB-IMAGE-140718-15
- Genes
- Publication
- Zigman et al., 2014 - Hoxb1b controls oriented cell division, cell shape and microtubule dynamics in neural tube morphogenesis
- All Figures
- Figures for Zigman et al., 2014
|
Fig. 3
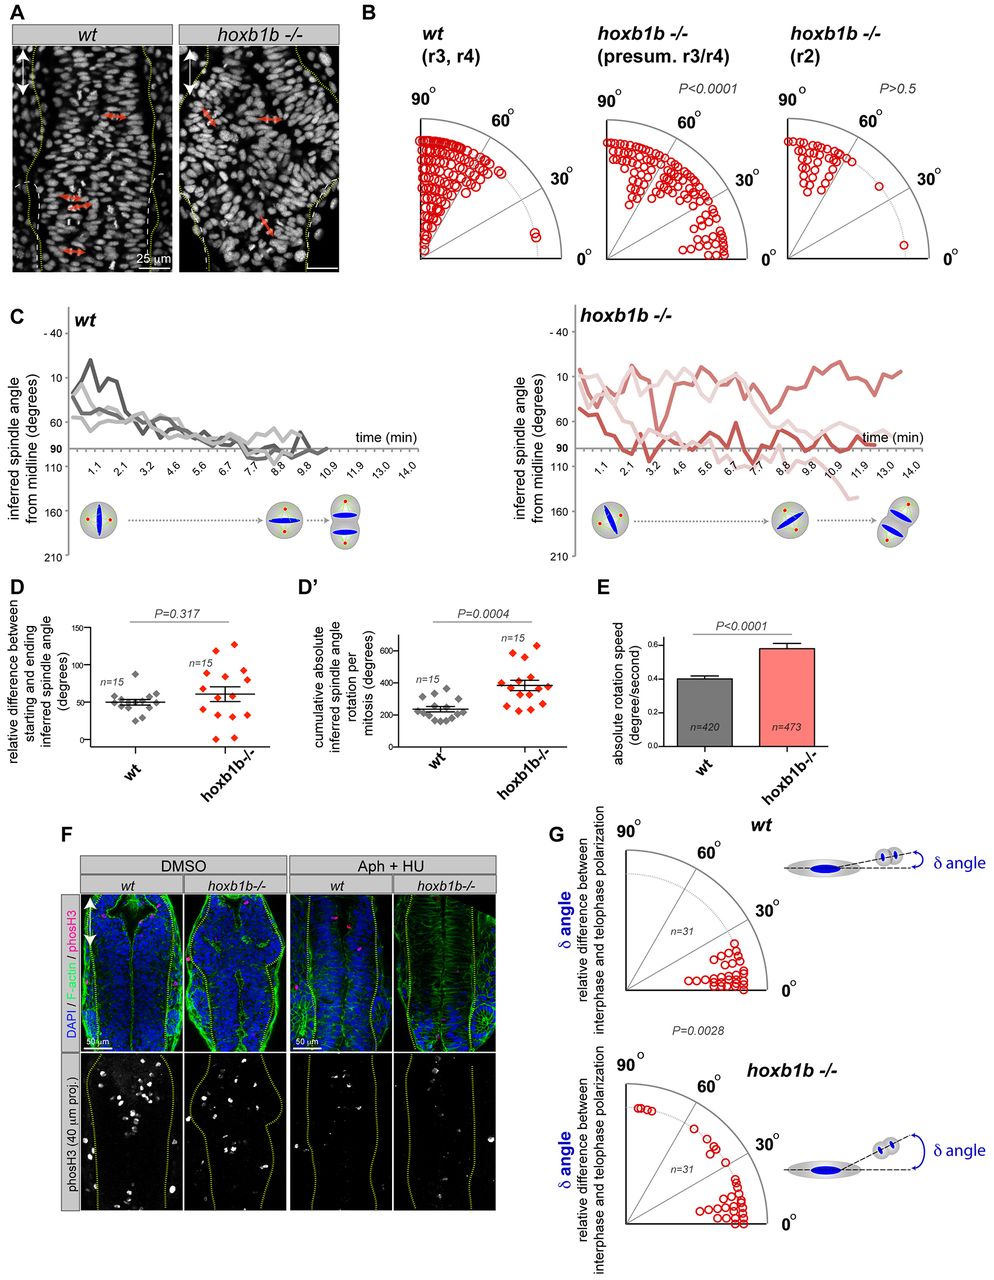
Hoxb1b regulates oriented cell division in the neural keel. (A) Tg(h2a.f/z-GFP) localizes to chromosomes that at anaphase reflect the orientation of cell division in the hindbrain (red arrows). (B) Quantification of mitosis orientation relative to the animal A/P axis (0°) in wild-type (n=153 cells, two embryos) and hoxb1b-/- (n=142 cells in r3/4 of hoxb1b-/- mutants with significantly abnormal mitosis orientation and n=41 cells in unaffected hoxb1b-/- r2 hindbrain region, three embryos for each). Imaging acquired at neural keel (12-15 hpf). (C) Representation of inferred spindle rotation relative to the A/P axis (0°) from time-lapse analysis of four wild-type and four hoxb1b-/- randomly chosen progenitors; additional tracks are shown in supplementary material Fig. S3A; the quantitation shown in D, D2 and E is based on n=15 single cell time lapses from each of three wild-type and three mutant embryos. Time interval is 21 seconds. (D) Relative difference between starting and ending inferred spindle orientation in wild-type and hoxb1b-/- mutant progenitors. (D2) Cumulative absolute spindle rotation (inferred from metaphase plate orientation) in wild type versus hoxb1b-/-. (E) Increased mitotic spindle rotation velocity (change in angle over time) in hoxb1b-/- compared with wild-type mitoses. (D-E) Graphs show the mean value with s.e.m. Hoxb1b is required for single-cell chromosome rotation independently of the prior interphase positioning. Quantitation of single cell behavior tracked over time when analyzed for the angle between the longest interphase nuclear axis prior to cell division and the axis of chromosome separation. (F) Rescue of abnormal lumen morphology by aphidicolin (Aph) and hydroxyurea (HU) incubation to block cell division in hoxb1b-/- (eight out of 11 hoxb1b-/- embryos) compared with control DMSO-treated hoxb1b-/- (seven out of eight hoxb1b-/- embryos). The lower panel shows the inhibition of proliferation caused by the drugs as verified by phosho-H3 staining. Double arrows mark the anterior-posterior axis. (G) Relative difference in the orientation (angle, degrees) between interphase and anaphase measured in individual wild-type and hoxb1b-/- cells, as schematized on the right.