
Fig. 6
- ID
- ZDB-IMAGE-140714-83
- Genes
- Publication
- Stawicki et al., 2014 - The zebrafish merovingian mutant reveals a role for pH regulation in hair cell toxicity and function
- All Figures
- Figures for Stawicki et al., 2014
|
Fig. 6
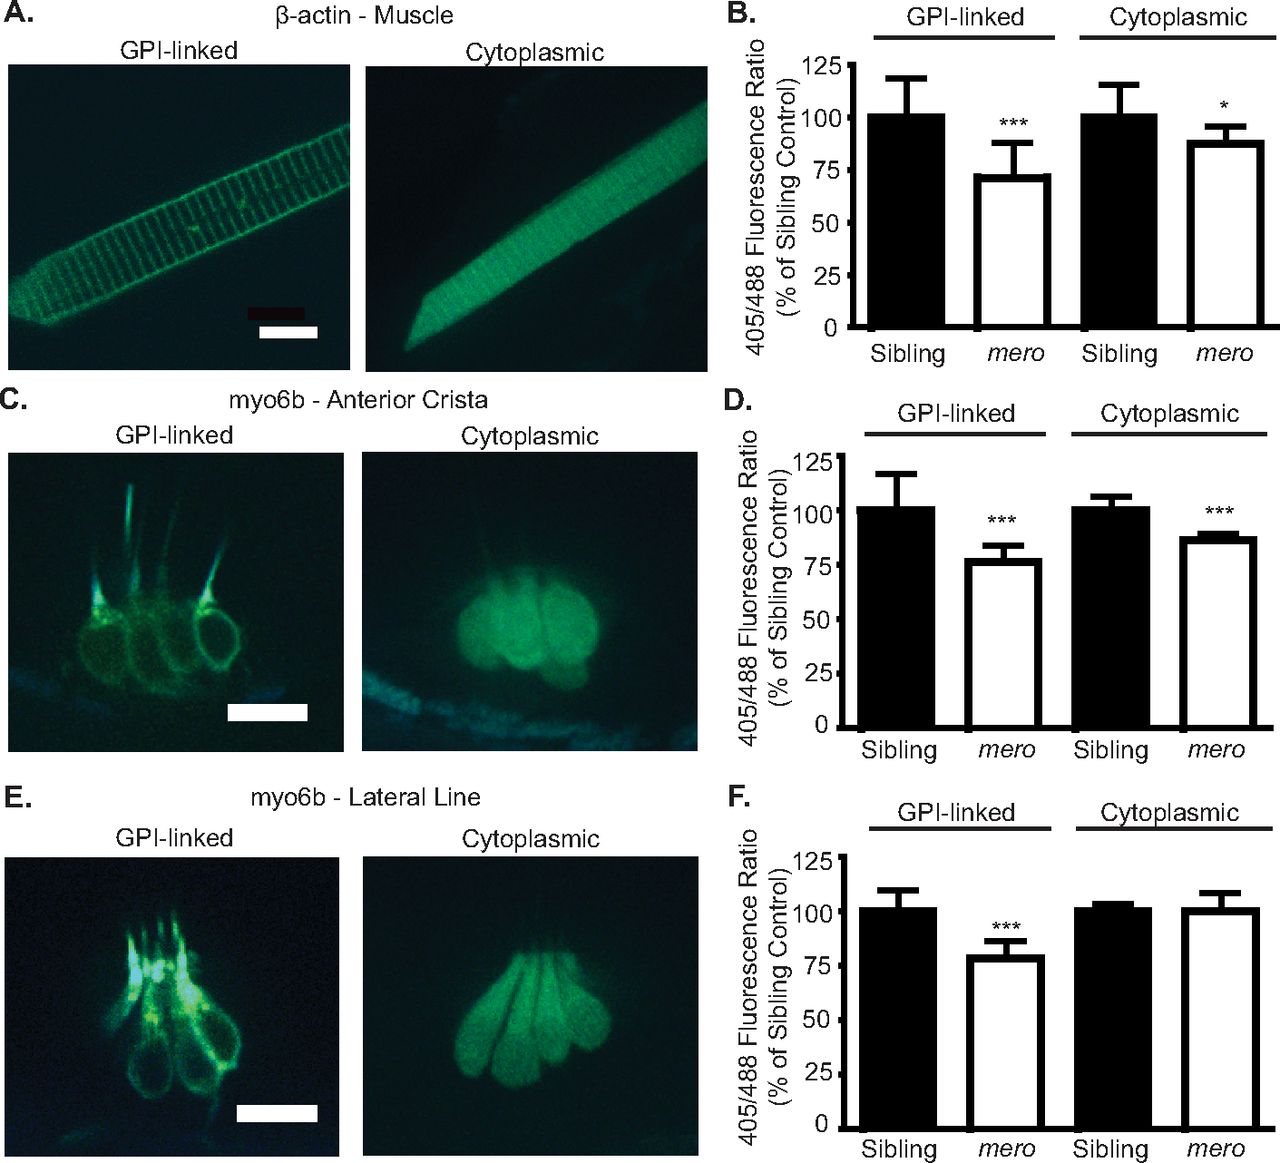
merovingian mutants show a decreased in extracellular pH throughout their body. (A) Images of both GPI-linked and cytoplasmic pHluorin2 expressed under the control of the β-actin promoter in muscle cells. (B) The extracellular (GPI-linked) and intracellular (cytoplasmic) environment of muscle cells is acidified in merovingian mutants, as measured by a decreased 405/488 ratio in the ratiometric fluorescent pH indicator pHluorin2 (n=20 fish). (C) Images of both GPI-linked and cytoplasmic pHluorin2 expressed under the control of the myosin6b promoter in hair cells of the inner ear. (D) The extracellular and intracellular environment of inner ear hair cells is acidified in merovingian mutants, as measured by a decreased 405/488 ratio in the ratiometric fluorescent pH indicator pHluorin2 (n=15–19 fish). (E) Images of both GPI-linked and cytoplasmic pHluorin2 expressed under the control of the myosin6b promoter in hair cells of the lateral line. (F) The extracellular, but not intracellular, environment of lateral line hair cells is acidified in merovingian mutants, as measured by a decreased 405/488 ratio in the ratiometric fluorescent pH indicator pHluorin2 (n=13–16 fish). Values were normalized to the 405/488 ratio of wild-type siblings for each construct. *P<0.05, ***P<0.001 by ANOVA and Bonferroni post-hoc test. Error bars indicate s.d. Scale bars: 10 μm.