
Fig. S7
- ID
- ZDB-IMAGE-140703-7
- Publication
- van der Vaart et al., 2014 - The DNA Damage-Regulated Autophagy Modulator DRAM1 Links Mycobacterial Recognition via TLR-MYD88 to Autophagic Defense
- All Figures
- Figures for van der Vaart et al., 2014
|
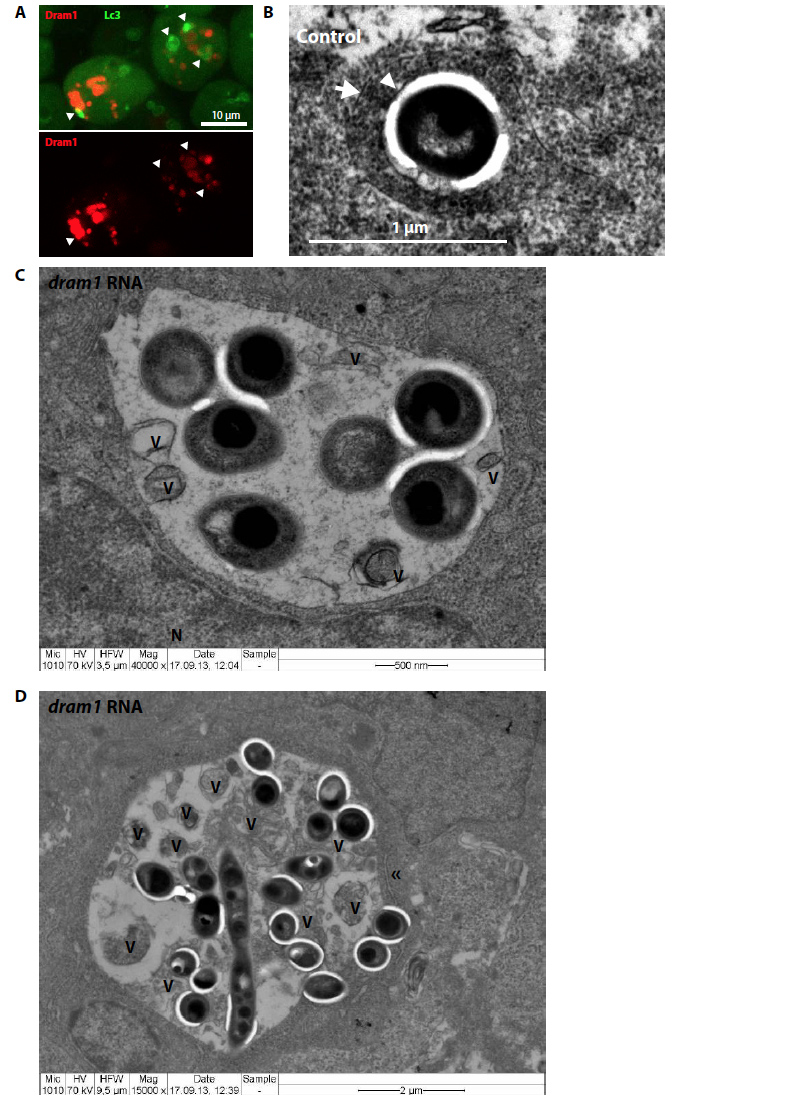
Fig. S7
Effect of Dram1 on autophagosomal vesicles and fusion events. (A) Representative confocal micrograph of GFP-Lc3 embryos transiently expressing mCherry- Dram1. Co-localization is indicated with arrowheads.
(B-D) Transmission electron micrograph of control or dram1 RNA injected embryos infected with Mm. (B) Bacteria (indicated by an arrowhead) inside an autophagolysome, as characterized by the presence of cytoplasmic material inside a singlemembraned vesicle (indicated by an arrow). (C-D) Two examples of large bacteria-containing vesicles, as frequently observed in dram1 overexpressed embryos infected with Mm. V= remnants of vesicular fusion; N = nucleus; « = doublemembrane.