
Fig. 4
- ID
- ZDB-IMAGE-140618-11
- Publication
- O'Donnell et al., 2014 - Axon degeneration and PGC-1alpha-mediated protection in a zebrafish model of alpha-synuclein toxicity
- All Figures
- Figures for O'Donnell et al., 2014
|
Fig. 4
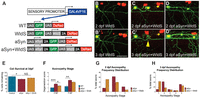
WldS delays axonopathy but does not prevent cell death caused by aSyn toxicity. (A) Transgenes used to visualize the effect of aSyn and WldS expression on peripheral sensory neurons. (B) Representative images of WldS-expressing control cells at 2 (B) and 3 (B2) days post-fertilization (dpf). Axons were smooth and continuous. (C,D) Representative images of cells expressing both aSyn and WldS. At 2 dpf, aSyn+WldS-expressing axons were on average more continuous (compare with aSyn in Fig. 2). WldS did not prevent degeneration of axons in cells that died between 2 and 3 dpf (C,C2 yellow arrowhead points to degenerated soma). Axons that remained connected to cell bodies were relatively preserved (D,D2). (E) WldS did not affect survival of aSyn-expressing cells between 2 and 3 dpf (WT: 95.65±4.35%; aSyn: 79.36±6.62%; WldS+aSyn: 86.86±4.43%; n=22 animals per group; *P=0.3515). (F) Average axonopathy stage at 2 and 3 dpf. WldS-expressing aSyn axons were significantly protected at 2 dpf (aSyn: 2.05±0.14, n=19 axons from 8 animals; WldS+aSyn: 1.57±0.11; n=35 axons from 11 animals, *P=0.0114). By 3 dpf, this difference was no longer significant (aSyn: 3.05±0.35; WldS+aSyn: 2.54±0.28; P=0.2766). ***P<0.0001; **P=0.0033. (G,H) Frequency distribution of axonopathy scores at 2 (G) and 3 (H) dpf. At 3 dpf, axons that underwent cell death (aSyn: 6/19, 31.6%; aSyn+WldS: 9/35, 25.7%) had fully degenerated (axonopathy stage 5), regardless of whether or not WldS was expressed. Wild-type and aSyn axonopathy data were replotted from Fig. 2. Scale bar: 50 μm.