
|
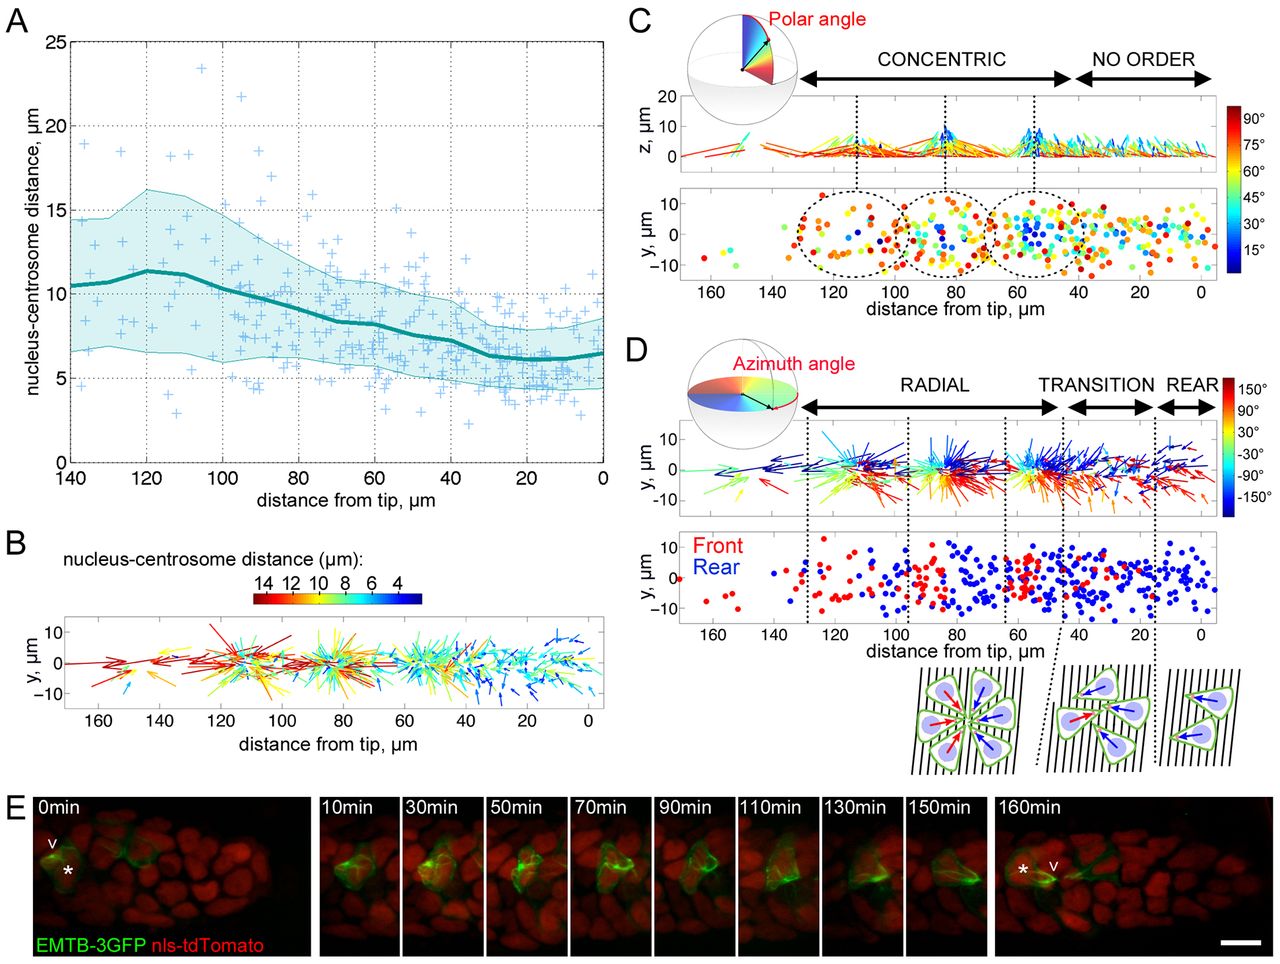
Fig. 2 Analysis of cell length and polarity changes during leader-to-follower transition. (A) Plot of the mean nucleus-centrosome distance (mean length±s.d. of the nuclear-centrosomal vectors) as a function of cell distance from the leading edge showing elongation from front to rear of the pLLP. (B) Nuclear-centrosomal vectors are colour coded according to their length, illustrating this progressive elongation. (C) Polar angles of cell polarity vectors colour coded and shown in the side view of the rosette-centred template pLLP (top) and corresponding colour coding of nuclei positions in top view (bottom). This measure of how upright cells stand shows the concentric organisation of the rosettes. (D) Polarity vectors colour coded according to their azimuth angles on a top view of the rosette-centred template pLLP (top) and plot of nuclei positions displayed in blue for rear-oriented cells and in red for front-oriented cells (bottom). This analysis of vector orientation in the migration plane demonstrates an evolution from rear-oriented to radially organised cells via a transition zone of mixed polarities. (E) Time-lapse images showing dynamically an EMTB-3GFP-expressing cell undergoing the transition from rear oriented to front oriented. The shifting cell nucleus is indicated by asterisks; chevrons indicate the brightest point of EMTB labelling that corresponds to the microtubule-organising centre. Scale bar: 10 µm.