
Fig. S5
- ID
- ZDB-IMAGE-140527-20
- Publication
- Chen et al., 2014 - Glycogen synthase kinase 3 inhibitors induce the canonical WNT/β-catenin pathway to suppress growth and self-renewal in embryonal rhabdomyosarcoma
- All Figures
- Figures for Chen et al., 2014
|
Fig. S5
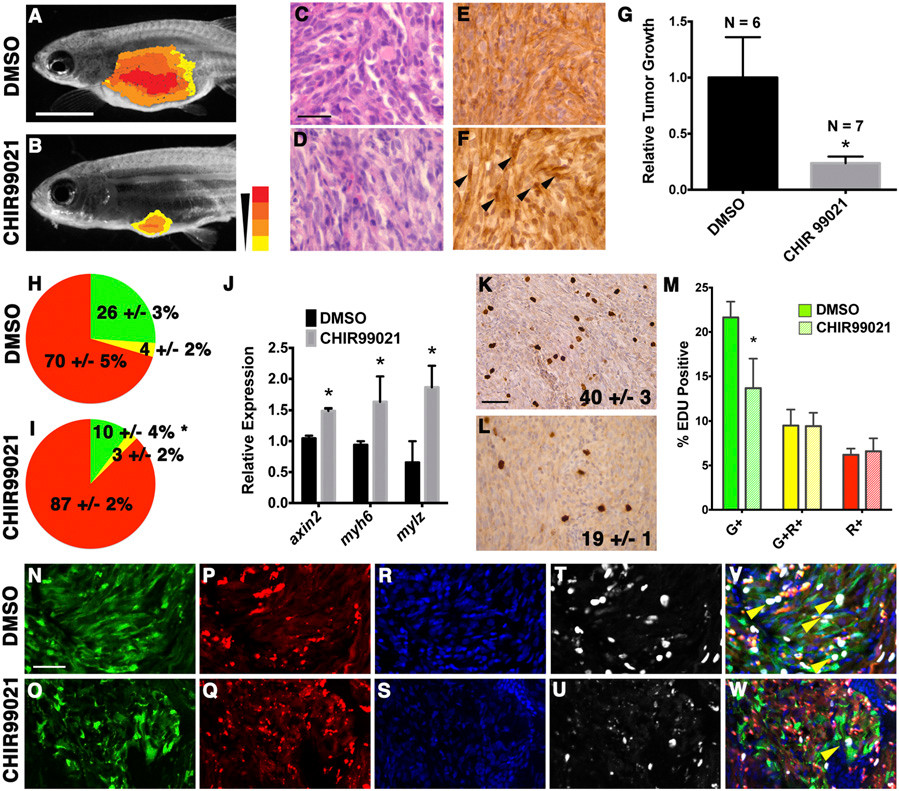
CHIR99021 inhibits ERMS tumor growth and alters differentiation of tumor cells. (A and B) Representative images of ERMS-bearing fish after 6 d of drug treatment with DMSO (A) or 400 nM CHIR99021 (B). (Scale bar, 0.2 cm.) Heat map scale indicates increasing tumor volume intensity. (C–F) H&E-stained sections (C and D) and immunohistochemistry for β-catenin (E and F). (Scale bar, 20 μm.) (G) Summary of tumor volume changes. N, number of tumor-bearing fish per treatment group. Each error bar denotes SEM. (H and I) Summary of frequency of tumor cell subpopulations upon treatment with (H) DMSO (vehicle) and (I) CHIR99021 by FACs analysis. Each pie chart represents an average of three tumor-bearing fish analyzed, showing the relative percentage of myf5:GFP+ /mylz2:mCherry tumor-propagating cells (green), myf5:GFP+/mylz2:mCherry+ (yellow), and late-differentiating myf5:GFP/mylz2:mCherry+ cells (red). SD for each fraction is indicated. *Significance of <0.05. (J) Quantitative RT-PCR analysis. *P < 0.05, Student t test. Each error bar indicates SEM. n = 3–4 tumors analyzed for each treatment group. (K and L) Immunohistochemistry for Phospho-H3 for DMSO- (K) and CHIR99021-treated (L) tumors. The number of Phospho-H3-positive cells was quantified in three independent fields at 400× magnification. The values (with SEM) indicate average of three tumors analyzed for each treatment group (P < 0.05). (Scale bar, 20 μm.) (M) Summary of EdU analysis. Larval fish engrafted with tumors expressing myf5:GFP and mylz2: mCherry were treated with DMSO or CHIR99021 and pulsed with EdU for IF analysis. Each error bar indicates SEM of three tumors from each treatment group. *P < 0.005, Student t test. (N–W) Representative images from EdU IF staining. GFP (N and O), mCherry (P and Q), DAPI (R and S), and EdU (T and U). (V and W) Merge image of all four channels. Yellow arrowheads, representative myf5:GFP+/mylz2:mCherry cells that have EDU incorporation. (Scale bar, 20 μm.)