
|
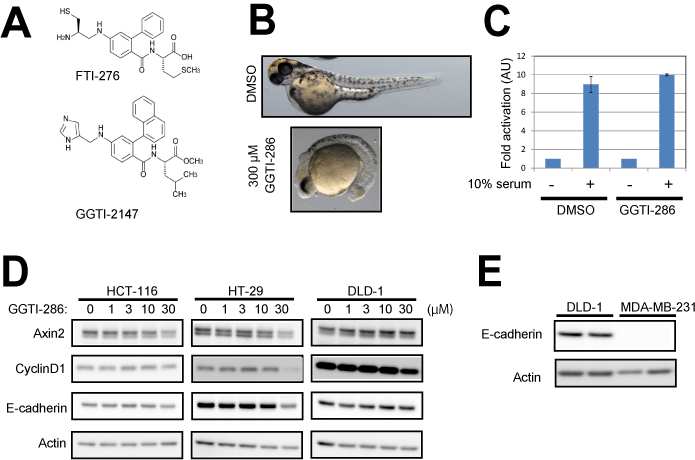
Fig. S2
Related to Figure 3. (A) Structures of FTI-276 and GGTI-286 are shown. (B) GGTI-286 reduced the posterior structure of zebrafish embryos. Embryos were treated with 300 µM GGTI-286 at 50% epiboly. Images were taken at 57 hpf (C) GGTI-286 did not inhibit serum-induced AP1 promoter activity. CHO cells were plated in 0.2% FBS/DMEM and transfected with SEAP (secreted alkaline phosphatase) reporter plasmids for AP1. The cells were pre-treated with 10 µM GGTI-286 for 6 hours, and treated with10% FBS for 18 hours. Culture media were assayed for SEAP activities. The normalized relative luciferase activities are shown as fold activation to cells cultured in 0.2% FBS/DMEM. Values are means +/- SEM (n= at least 3). (D) GGTI-286 was less effective on expression levels of Cyclin D1 and Axin2 in colon cancer cell lines with E-cadherin expression. The cells were treated with 1-30 µM GGTI-286 for 18 hours. Cell lysates were analyzed by western blotting with antibodies against Cyclin D1, Axin2, E-cadherin, and Actin. Because these colon cancer cell lines possess activated Wnt/-catenin signaling, Wnt3A stimulation was omitted. (E) MDA-MB-231 cells lack endogenous E-cadherin expression.