
Fig. 1
- ID
- ZDB-IMAGE-140522-65
- Publication
- Bonetti et al., 2014 - Noonan and LEOPARD syndrome Shp2 variants induce heart displacement defects in zebrafish
- All Figures
- Figures for Bonetti et al., 2014
|
Fig. 1
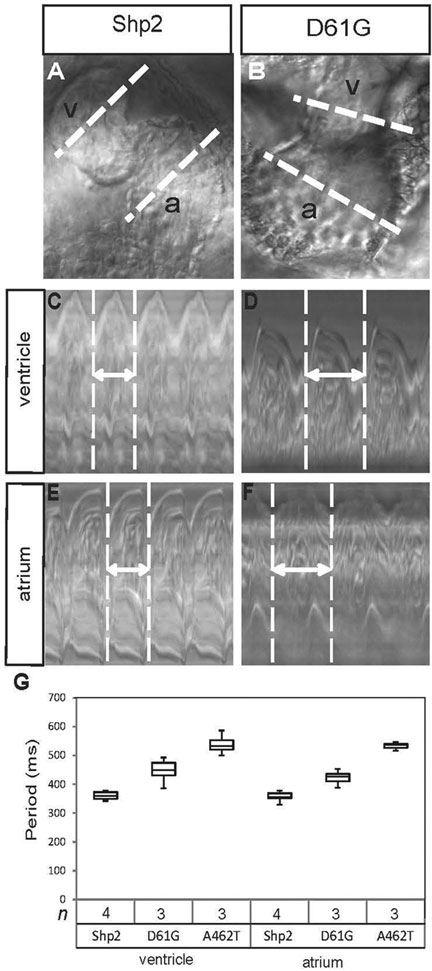
Impaired cardiac function in embryos expressing Shp2-D61G and Shp2-A462T. (A,B) The hearts of WT-Shp2- (Shp2) and Shp2-D61Gexpressing zebrafish embryos were imaged by high-speed video recording microscopy at 2 dpf. White dotted lines through the atrium (a) and the ventricle (v) are indicated. (C-F) Ventricular (C,D) and atrial (E,F) kymographs from 2 dpf embryonic hearts. Note the longer period of the Shp2-D61G-expressing heart, compared with the WT-Shp2-expressing heart (double-headed arrow and white dotted vertical lines). (G) Quantitative analysis of the heart period in the ventricle or atrium of WT-Shp2, Shp2-D61G and Shp2-A462T expressing embryos (n indicates number). Whisker plots are depicted.