
Fig. 6
- ID
- ZDB-IMAGE-140522-62
- Publication
- Almeida et al., 2014 - Spectrum of Fates: a new approach to the study of the developing zebrafish retina
- All Figures
- Figures for Almeida et al., 2014
|
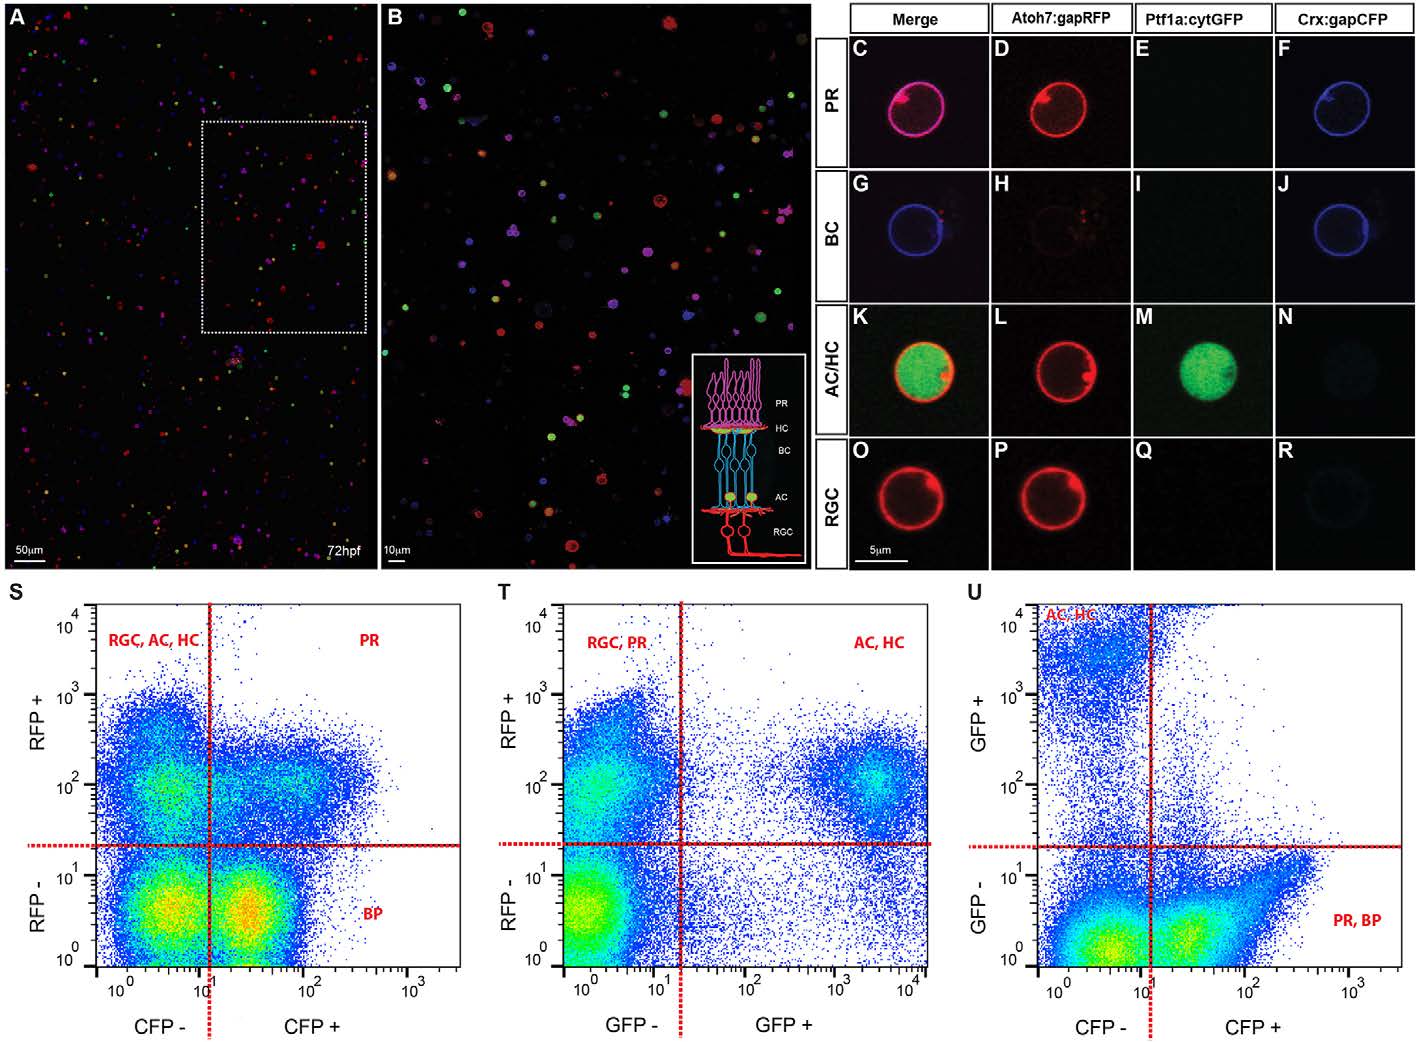
Fig. 6 Cell type identification in dissociated retinal cultures. (A,B) SoFa1-dissociated retinal cells and correspondent high magnification inset, showing that all cell types can be easily identified by their specific combination of colours. (C-R) Representative images of cells of each cell type (red, green and blue channels shown separately and merged). PRs are labelled in purple, as they express both Atoh7 and Crx (C); BCs are labelled in blue, as most of them express exclusively Crx (G); AC and HC are labelled in red and green, as they express both Atoh7 and Ptf1a (K); and RGCs are labelled in red, as all express Atoh7 (O). (S-U) Flow cytometry profiles of dissociated SoFa1 retinas, showing that it is possible to sort the different retinal populations. (S) RFP and CFP profile; (T) RFP and GFP profile; and (U) GFP and CFP profile.