
Fig. 3
- ID
- ZDB-IMAGE-140522-59
- Publication
- Almeida et al., 2014 - Spectrum of Fates: a new approach to the study of the developing zebrafish retina
- All Figures
- Figures for Almeida et al., 2014
|
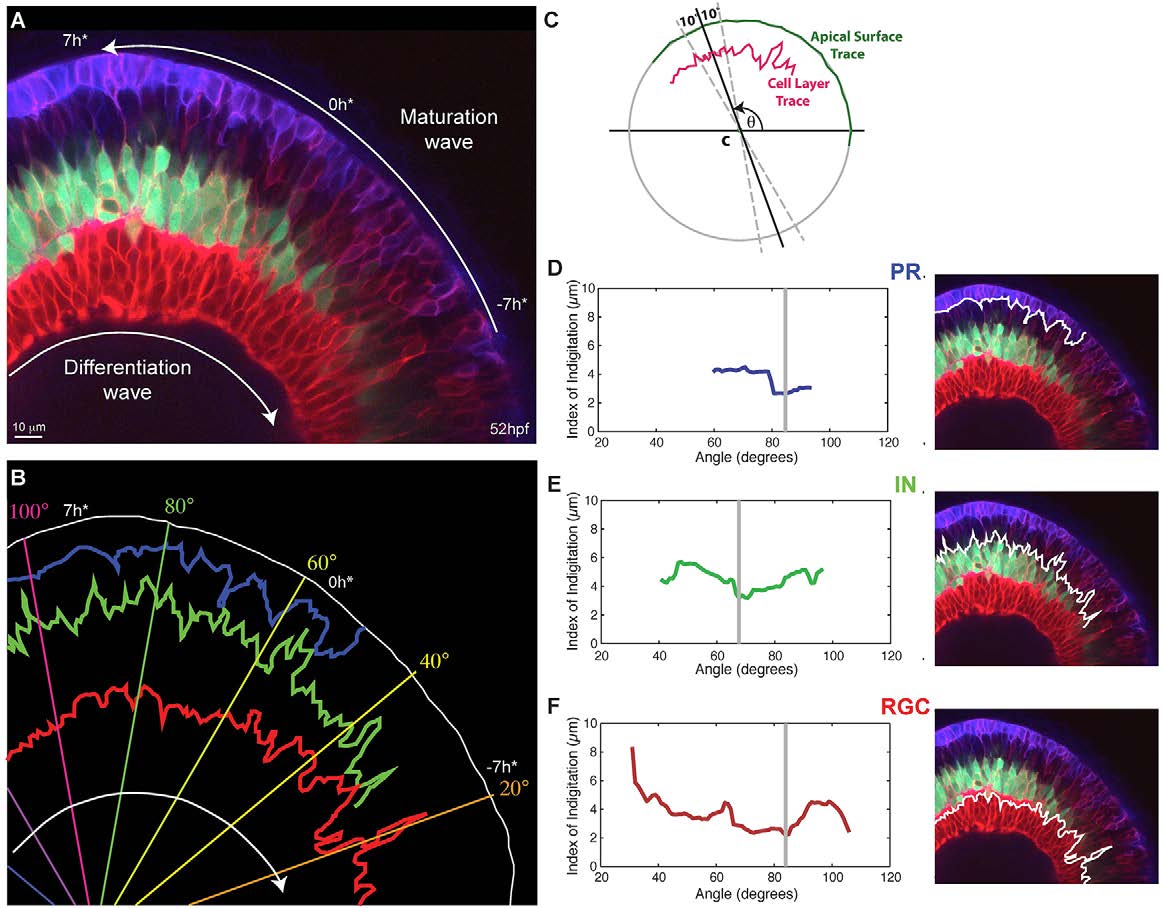
Fig. 3 Interdigitation of emerging cell types. (A) Snapshot of a 52 hpf retina showing various degrees of interdigitation of the different cell types along the differentiation wave. The timescale, which references time in hours to the first appearance of the proto-IPL (0 h*), is based on matching the degree of lamination along the maturation wave to what we observe in our timelapse movies, where retinal lamination of a small section of the retina is followed over time (e.g. supplementary material Movie 2). (B) Traces of the apical surface (white), the basal side of the photoreceptor (PR) layer (blue), the apical side of the inhibitory neuron (IN) layer (green) and apical side of the retinal ganglion cell (RGC) layer (red) from when they first appear continuous. (C) A schematic showing how the Index of Interdigitation is calculated. (D-F) The Index of Interdigitation varies across the maturation wave for the basal side of the PR layer (D), the apical side of the IN layer (E) and the apical side of the RGC layer (F). The grey line marks the absolute minimum in each graph.