
Fig. 6
- ID
- ZDB-IMAGE-140506-66
- Publication
- Stewart et al., 2014 - Sequential and opposing activities of Wnt and BMP coordinate zebrafish bone regeneration
- All Figures
- Figures for Stewart et al., 2014
|
Fig. 6
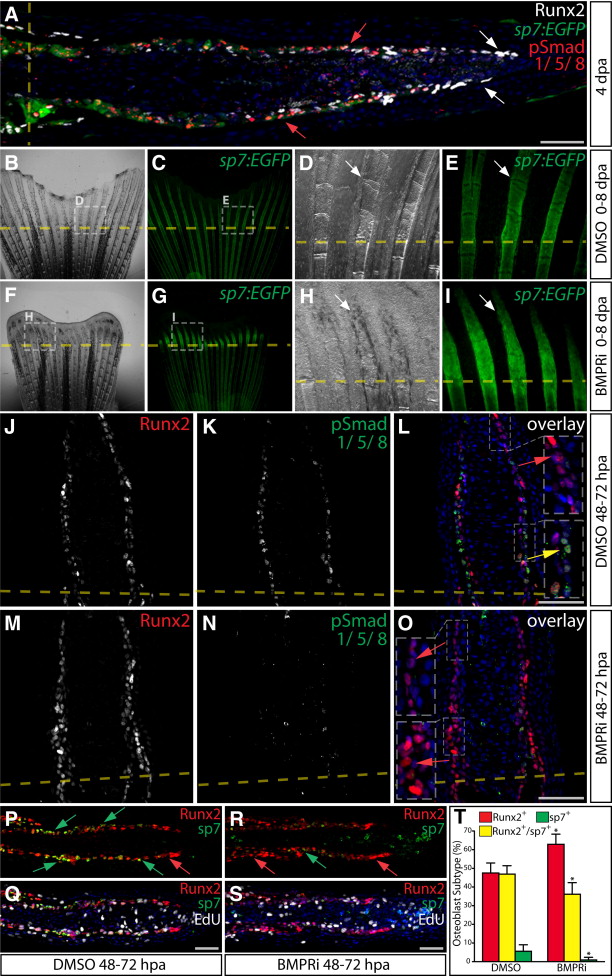
BMP/Smad Signaling Promotes Osteoblast Differentiation and sp7 Expression during Bone Regeneration
(A) Runx2 (white), sp7:EGFP (green) and pSmad1/5/8 (red) levels on sections from a Tg(sp7:EGFP) fish 4 dpa. White arrows point to Runx2+/pSmad preosteoblasts. Red arrows indicate sp7+/pSmad1/5/8+ osteoblasts. The amputation site is marked with a dashed yellow line.
(B–I) Whole-mount images of regenerating fins of Tg(sp7:EGFP) fish at 8 dpa after DMSO (B–E) or BMPRi exposure (F–I, 5 μM from 0 to 8 dpa). Rotterman contrast (B, D, F, and H) and epifluorescence images (C, E, G, and I) to visualize sp7:EGFP expression (green) are shown. White arrows indicate osteoblasts. Representative images from one of three fish in each of the control and BMPRi groups are shown at low and high magnification.
(J–O) Antibody-stained fin sections showing Runx2 (red) and pSmad1/5/8 (green) levels in fish 72 hpa exposed to DMSO (J–L) or BMPRi (M–O, 5 μM BMPRi at 48–72 hpa). Red arrows indicate Runx2+/pSmad cells, and the yellow arrow points to a Runx2low/pSmad1/5/8+ cell. Insets show magnified boxed regions.
(P–S) EdU (white) incorporation in Runx2- (red) and sp7- (green) expressing cells in fin sections from DMSO (P and Q) and BMPRi-exposed animals (R and S, 5 μM at 48–72 hpa). Red arrows indicate Runx2+ cells and green arrows point to sp7+ cells. Overlay panels show Hoechst-stained nuclei in blue. Scale bars represent 50 µm.
(T) The percentage of Runx2+ (red bars), Runx2+/sp7+ (yellow bars), and sp7+ cells (green bars) in fin sections from DMSO (48–72 hpa) versus BMPRi-treated (5 μM, 48–72 hpa) zebrafish. Four rays from three BMPRi-exposed animals containing a combined >400 osteoblasts were scored. The DMSO sample data are shared with the experiment shown in Figure 5I. Error bars are one SD, and significant p values are indicated with an asterisk (p < 0.002 for increased Runx2+ cells; p < 0.007 for a decrease in Runx2+/sp7+ cells; and p < 0.02 for a decreased sp7+ population, Student’s t tests).