
Image
|
Figure Caption
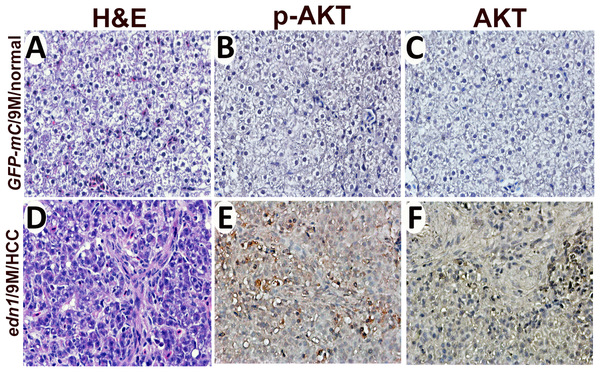
Fig. 8
Expression of p-AKT and AKT in the edn1 transgenic fish.
(A) and (D) depict H&E staining of the liver sections of the GFP-mCherry control and edn1 transgenic fish. (B-C) and (E-F) shows the IHC staining using an anti-phospho-AKT antibody (B and E) or an anti-AKT antibody (C and F).
Acknowledgments
This image is the copyrighted work of the attributed author or publisher, and
ZFIN has permission only to display this image to its users.
Additional permissions should be obtained from the applicable author or publisher of the image.
Full text @ PLoS One