
|
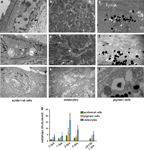
Fig. 2
Ultrastructural evidence for an increase in autophagy in the regenerating blastema tissue. Electron microscopy pictures of epidermal cells (a), osteocytes (b) and pigment cells (c) from the tail tip region of control animals show no sign or only low levels of autophagic activity. In the corresponding tissues of the regenerating zone of a 2-dpa fin, elevated numbers of autophagic structures (arrowheads) can be observed (d–f2). (g) The quantification of autophagic vesicles in our EM data set shows a temporary increase in the number of these structures, with the maximum observed at 2dpa and a consequent decrease by 4dpa (n=25 for 0-dpa, 1-dpa and 2-dpa samples, and n=15 for the 4-dpa data set). The difference is highly significant for all three examined cell types (P<0.005). In U0126-treated animals (n=25) at 2dpa, the amount of autophagic structures is significantly lower (P<0.0001) (Student’s t-test, error bars refer to S.E.M.)