
|
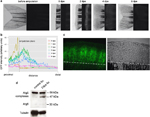
Fig. 1
Autophagy is upregulated during zebrafish caudal fin regeneration. (a) Intense accumulation of the autophagy marker Lc3Atg8 in the blastema tissue. Expression of GFP-Lc3 in a zebrafish caudal fin before, at the time of amputation and 2, 4 and 6 days thereafter (dpa). Left: light microscopy images; right: the corresponding fluorescent images. (b) Quantification of fluorescence intensity for a representative fin ray during regeneration. The plane of amputation is kept fixed, and fluorescence is shown relative to this position. Intensity was plotted for the same fin ray over the regeneration period using ImageJ. (c) Confocal images of a 2dpa GFP-Lc3 blastema. Some GFP-positive foci labelling autophagic elements are interconnected by filamentous structures. The white broken line indicates the amputation plane. (d) Western blots of intact and regenerating tails indicate a strong increase in the amount of complexed Atg5. On average, the amount of Atg5 complexes is roughly 60% higher in 2dpa regenerates than in control tissues, and in regenerating blastemas, we consistently detect a new ~47-kDa complex, besides the more common ~56-kDa one