
Fig. S3
- ID
- ZDB-IMAGE-140324-15
- Publication
- Samson et al., 2013 - 3-OST-7 regulates BMP-dependent cardiac contraction
- All Figures
- Figures for Samson et al., 2013
|
Fig. S3
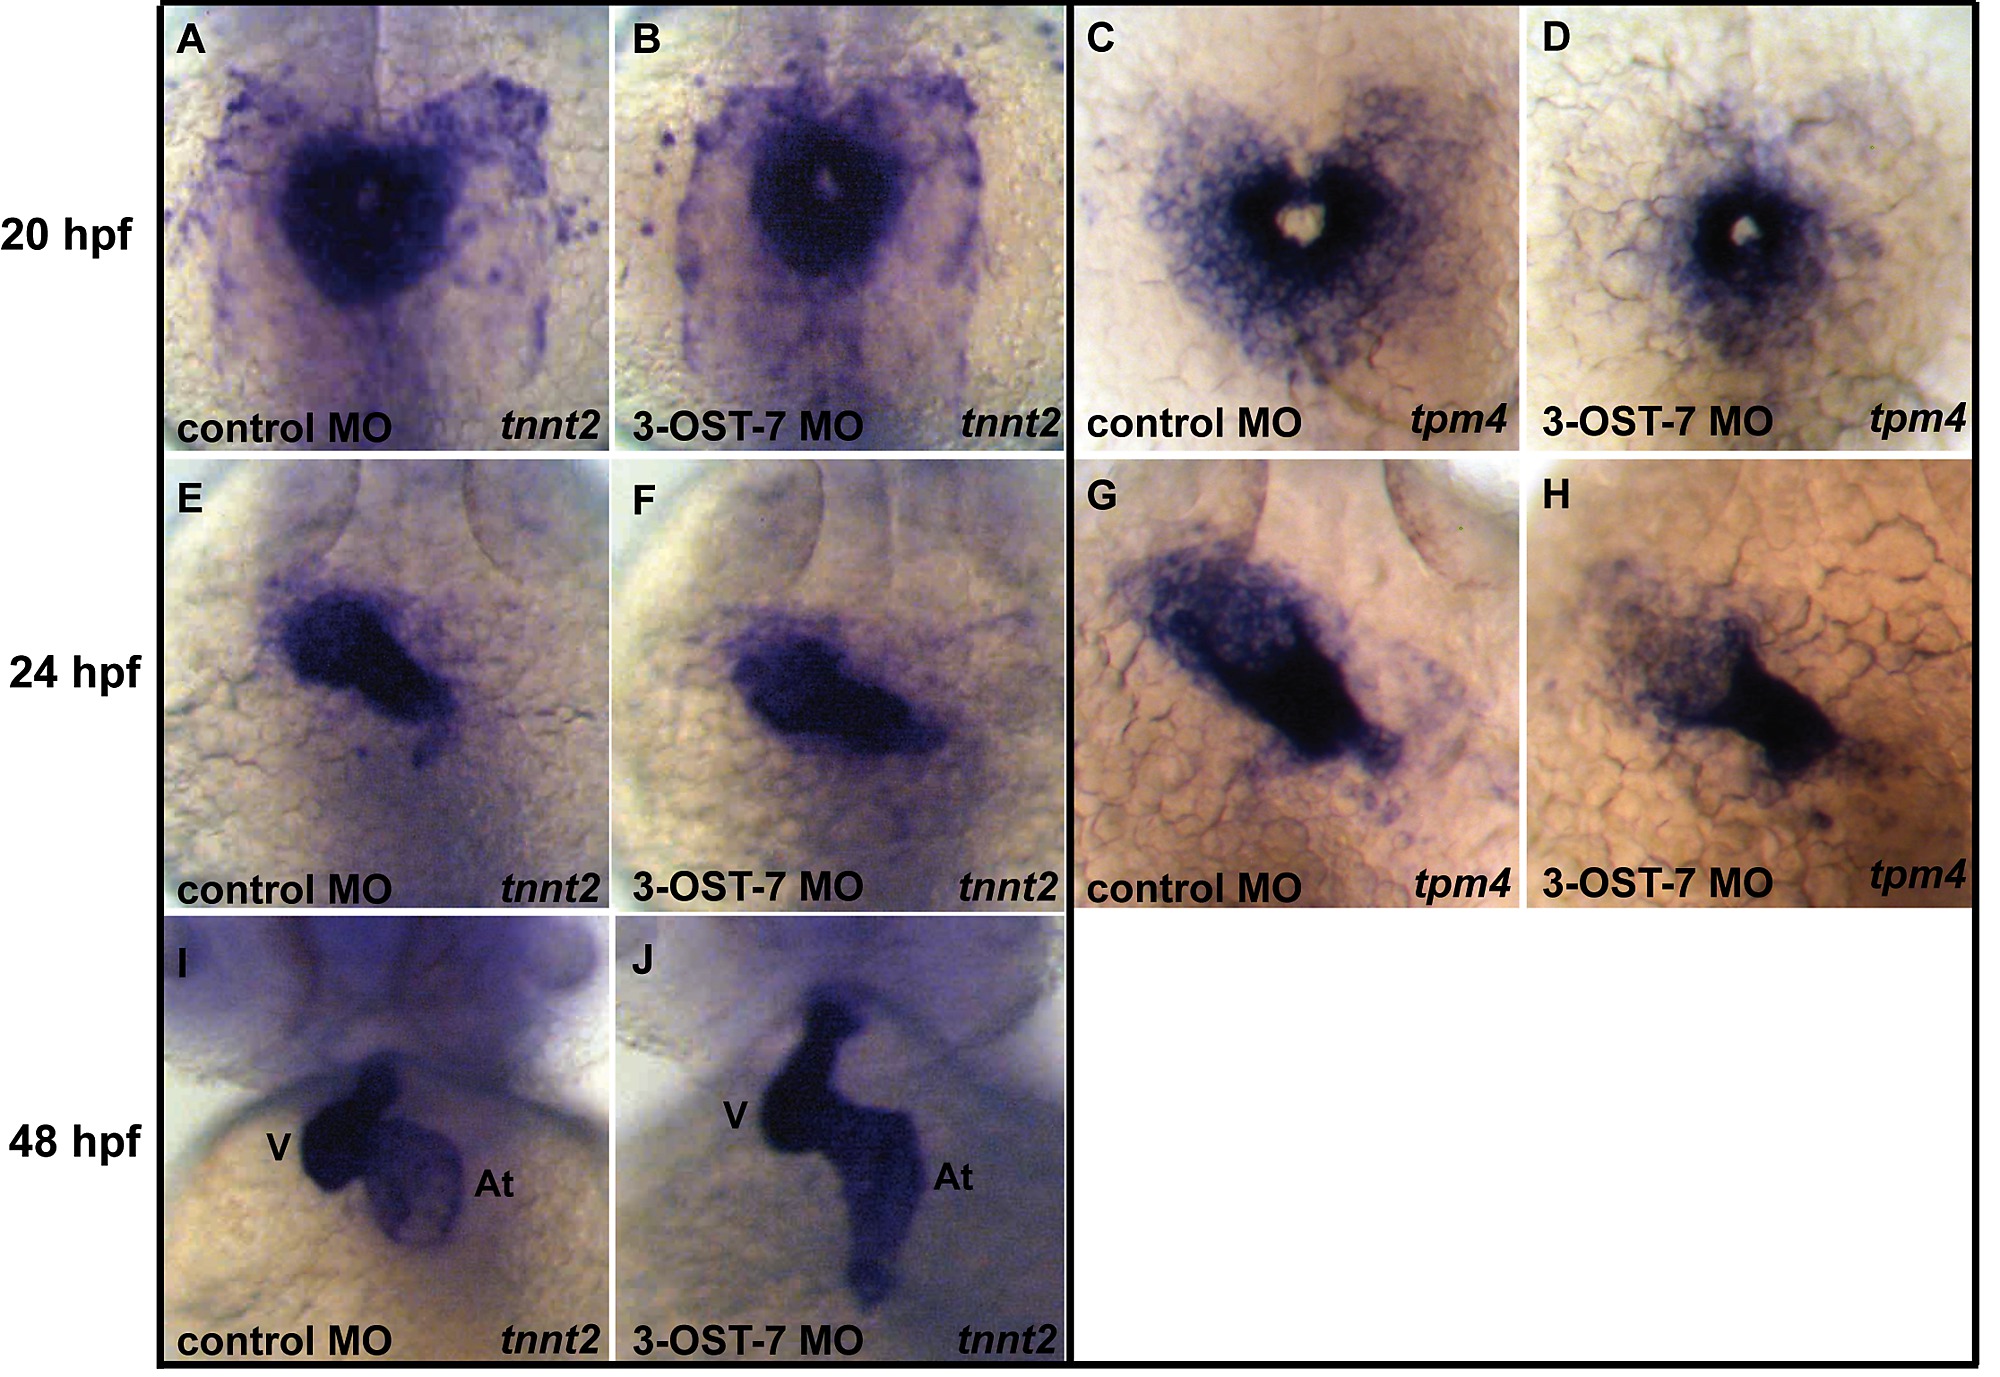
3-OST-7 controls transcript levels of tpm4 but not those of tnnt2. In situ analysis for tnnt2 showed comparable transcript levels and patterns of expression for 3-OST-7 morphants (B, F, and J) and control (injected with control 3-OST-3Z MO) embryos (A, E, and I) at 20 hpf (A and B), 24 hpf (E and F), and 48 hpf (I and J). In contrast, tpm4 transcripts were decreased in 3-OST-7 morphants (D and H) compared to control embryos (C and G) at 20 hpf (C and D) and 24 hpf (G and H). (A–D) are dorsal views with anterior on top; (E–J) are ventral views with anterior on top; n = 40 for each group. At, atrium; V, ventricle.