
Fig. 4
- ID
- ZDB-IMAGE-140313-6
- Publication
- Renucci et al., 1996 - An activated form of type I serine/threonine kinase receptor TARAM-A reveals a specific signalling pathway involved in fish head organiser formation
- All Figures
- Figures for Renucci et al., 1996
|
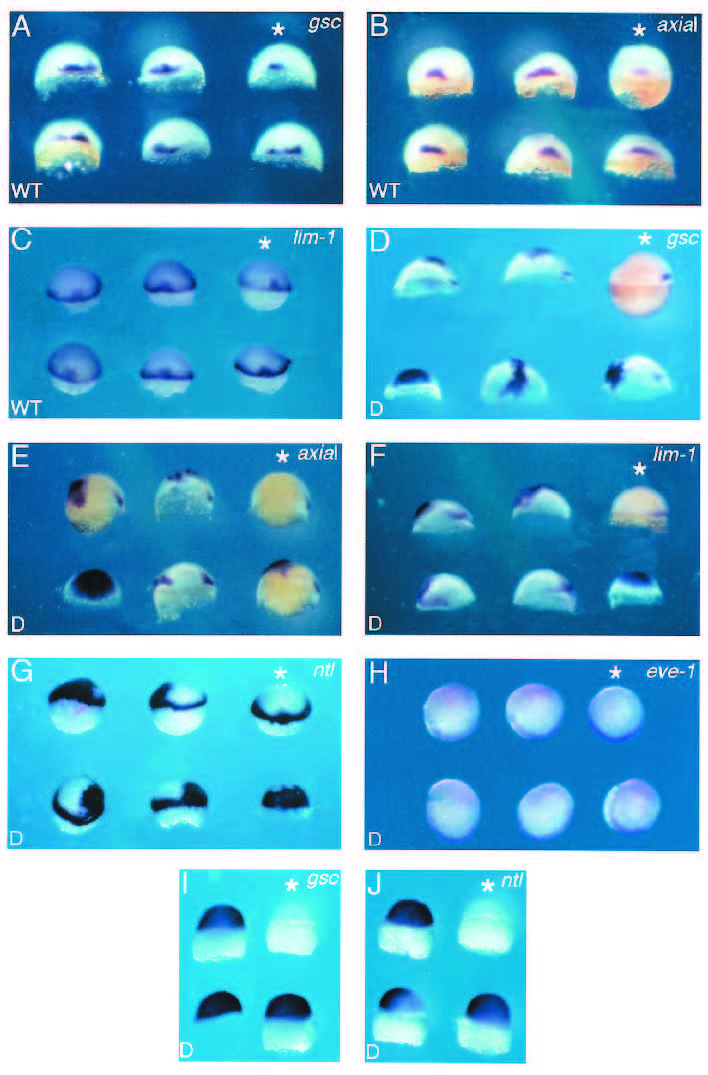
Fig. 4 In vivo analysis of TARAM-A and TARAM-A-D activities; expression of mesodermal markers (indicated in the upper right corner of each picture) in zebrafish late blastula (50% epiboly) (A-H), or high-blastula stage (3.5 h) (I,J). Embryos were injected at the 1- or 2-cell stage into the animal pole region with TARAM-A-WT (200 mg/ml), or with TARAM-A-D at 0.1 or 2 mg/ml. The asterisk indicates non-injected control embryo. (A-C) Expression of gsc, axial and lim-1 respectively upon TARAM-A-WT overexpression (dorsal view). TARAM-A-WT induces an enlargment or a local duplication of the gsc, axial and lim-1 domains in the shield area. (D-G) Expression of TARAM-A-D RNA (0.1 or 2 mg/ml) induces in varied locations large and thickened ectopic dorsal mesoderm (side view, dorsal to the left). In each case, one embryo injected with 2 mg/ml RNA is included and exhibits expression of the marker in the entire blastoderm. Expression of TARAM-A-D RNA (0.1 or 2 mg/ml) does not induce ectopic expression of a ventral marker eve-1 (H), (animal pole view, dorsal to the top). At 50% epiboly, eve-1 follows an arch of 180° on the marginal zone opposite the dorsal side. This arc is slightly reduced in injected embryos (the pink staining corresponds to the lineage tracer coinjected with the RNA). (I,J) Early onset of gsc and ntl expression in high blastula following injection of TARAM-A-D RNA. Induced expression is visible before the endogenous expression can be detected particularly for ntl RNA.