
IMAGE
Fig. 4
- ID
- ZDB-IMAGE-140307-19
- Genes
- Publication
- Pfeffer et al., 1998 - Characterization of three novel members of the zebrafish Pax2/5/8 family: dependency of Pax5 and Pax8 expression on the Pax2.1 (noi) function
- All Figures
- Figures for Pfeffer et al., 1998
Image
|
Figure Caption
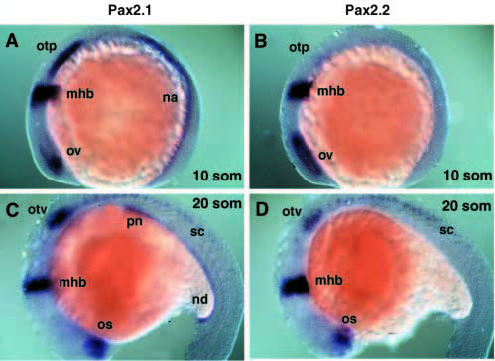
Fig. 4 Comparison of the Pax2.1 and Pax2.2 expression patterns. The expression of Pax2.1 (A,C) and Pax2.2 (B,D) was analyzed by whole-mount in situ hybridization in 10- and 20-somite embryos (shown in lateral view). For abbreviations see legend to Fig. 3.
Figure Data
Acknowledgments
This image is the copyrighted work of the attributed author or publisher, and
ZFIN has permission only to display this image to its users.
Additional permissions should be obtained from the applicable author or publisher of the image.
Full text @ Development